Author: Helen Thomas

Dillard’s, Macy’s, Nordstrom and Kohl’s Q2 Sales Report

Sales Report

Four major department stores reported Q2 results this week. Dillard’s reported net income of $49.2 million for the quarter, compared to $89.5 million in Q1. While that is a significant drop from quarter to quarter, year over year net sales were close, with $1.427 billion this year compared to $1.452 billion in 2016. Comp store sales were down just 1%. The merchandise mix showed ladies’ apparel increasing slightly, but sales in shoes, cosmetics and home were slightly decreased. Dillard’s CEO, William T. Dillard, stated, “Significant markdowns led to a disappointing loss as we dealt with inventory, which was up 2% at quarter end.”

Macy’s also reported a loss for the quarter, but still topped industry estimates. Macy’s sales totaled $5.55 billion for the quarter, down 5.4% from last year. Same store sales dropped 2.8%. Macy’s has been working on many changes in strategy including new women’s shoe and jewelry models and the rollout of its off-price Backstage format. They are planning to launch a new loyalty program and a new marketing strategy this fall. Macy’s also opened 16 Bluemercury stores and 12 Backstage stores during the second quarter.

Kohl’s also beat industry expectations while still reporting a loss. Net sales declined 1% to $4.14 billion, reporting a 6th straight quarter of decline. Same store sales fell 0.4%. The retailer reported that July transactions were an increase. Kohl’s has been working on expense reductions and inventory management to improve profit margins. It also added new vendor Under Armour that increased its activewear business.

Nordstrom came out ahead, reporting an increase of comp same store sales by 1.7%.

Sources: WSJ, Chain Store Age

Home Improvement Spending Rising for Boomers and Millennials

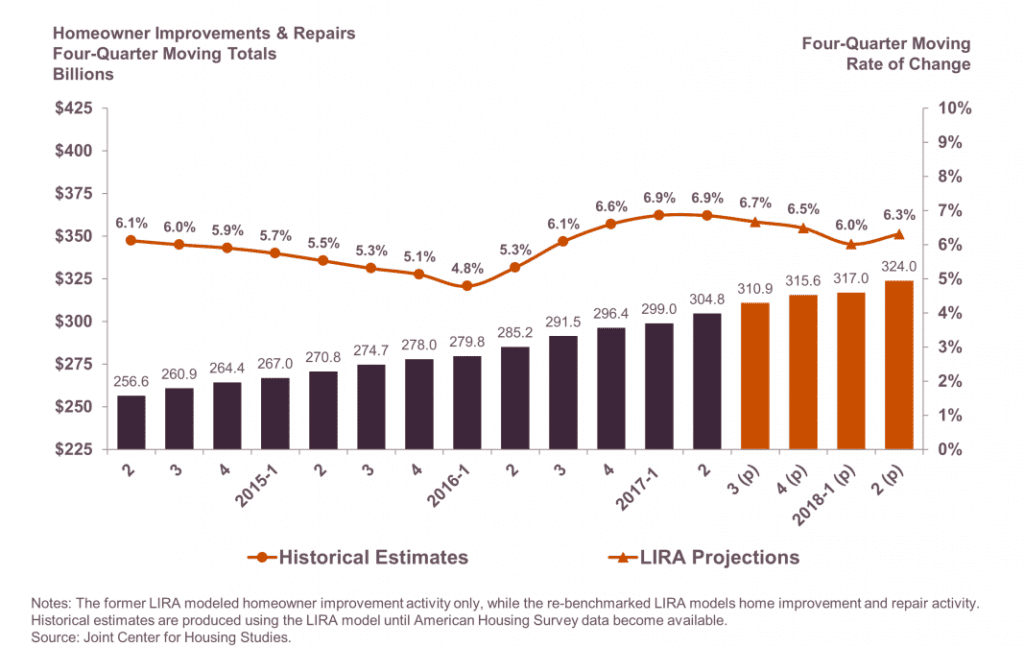
The Wall Street Journal announced this week that Harvard University’s Joint Center for Housing Studies has reported an expectation of American spending on home improvements this year to top $316 billion. This latest boom in spending is being driven mostly by two groups on opposite ends of the age spectrum: baby boomers and millennials. Increasing housing costs are driving more Americans to stay in the homes Home Improvement Spending Going Upthey currently have and make upgrades, or buy older homes that require more renovations. The WSJ report states that baby boomers are staying in their homes longer and are living longer, so are doing more renovation projects. Due to this influx of DIY projects, home improvement retailers are continuing to report successes. The Home Depot will be announcing their Q2 results on August 15 and economists are expecting to see increases in year-over-year store comps. This follows Home Depot’s Q1 reporting of 6% increases in same-store comps. Last year Americans spent $296 billion on home improvements. If the growth to $316 billion is realized, spending this year will increase by 7%.

Sources: WSJ, HardwareRetailing.com

Why All the Doom and Gloom? Retail is Up!

Forrester announced retail sales results just as the first half of an NRF/4-5-4/4-4-5 2017 season has come to a close. For most retailers, this week marks the first for the fall season/second half of the 2017 retail year. The news seems abundant about retail stores closings, missed sales targets and retail executives not getting bonuses, but retail is actually doing well! The US retail market has grown 3.8% so far this year, already surpassing 2016’s 2.4% growth. Sales are expected to hit $3.56 trillion this year.Retail Sales are Up

Online sales are expected to rise 14% this year to $459 billion, making 12.9% or total retail sales. Apparel, consumer electronics and computers still dominate as top producing products sold online. The news is also full of doom and gloom about Amazon hurting other retailers, but Forrester announced that while Amazon is growing at 19% over 2016 and last year 83% of adult Americans purchased at least once from Amazon, 55% also admitted using Amazon online as a resource to research products before physically purchasing elsewhere.

Are online sales hurting brick and mortar stores as much as we hear? Ecommerce sales do cause damage to retailers’ margins as they shift to a variable-cost model from a fixed-cost store model. Stores have been closing: 2000 in 2016 and a combined total of 10,000 over the past 3 years, but those stores actually are only 0.7% of the 1.44 million retail establishments in the US. Retail square footage per person in the US is averaging 24 square feet versus 16 square feet for Canadians and 4.6 square feet for every Briton. In May, 2,861 store openings were announced, proving retailers are strategically closing in weak malls.

Forrester stated in its report that the main thing holding retailers back right now is “unresolved pain points, undifferentiated (customer) experiences, decisions based on opinion rather than data”.

Sources: Retaildive.com, Marketwatch

Our Commitment to Confidentiality

Warwick Allen joined Accelerated Analytics at the start of 2017 as the Director of Technology. Warwick has spent 25 years working with technology as a developer, project manager, quality assurance engineer, business analyst, IT manager and technology director. His talents lie in working with small companies to plan and execute their growth through collaboration, processes and technology strategy.

As a SaaS solution for retail POS data reporting and analytics, our customers share a vast amount of data with us, much of which is highly confidential.  We’re routinely working with sensitive information like product pricing, inventory levels, sales goals and promotion plans. Trust and security are critical components of our customer relationships, which we take very seriously.

During the first several months of my tenure with Accelerated Analytics, I completed a comprehensive security audit of all internal and external technology and data-sharing systems in use at Accelerated Analytics – everything from servers and databases to user access and data transfer protocols.  We added technology security policies and procedures to an existing technology and security protocol that was already outstanding.

Our customers’ data is transferred and secured in several different ways. We offer our customers different options for data security including dedicated physical servers, shared physical servers with data separated logically, or cloud options with both dedicated and shared virtual server options. We use data encryption when appropriate and secure data transmission using AS2 and VAN mailboxes. Additionally, we require username and password authentication for websites, servers or data integration tools used by employees and/or customers.

We maintain a detailed technology security program that includes policies and procedures for overall technology security strategy, data backups and handling policies, incident response and business continuity, and personnel security. Our employees participate in regular technology security training sessions, and technology security training is a standard part of all new employee onboarding.

With these data security and confidentiality best practices in place, we ensure that our customers’ data is:

  • Complete. We can send acknowledgements for each file that is transmitted to verify it has been received. Clients are alerted if an expected file is not received.
  • Correct. Exhaustive processing rules highlight any inaccuracies, duplicates or missing data.
  • Processed on time. Automated routines process incoming data files without the need for manual intervention. Alerts are triggered if files are not available or cannot be processed.
  • Archived securely. Any file can be retrieved for analysis or reprocessing.
  • Secure in our databases and on our servers.

Our customers can continue to have complete confidence in the security and confidentiality of the data they share with Accelerated Analytics.


Retail Data Scientist Makes Glassdoor’s List For 25 Best Jobs In America

And job opportunities are booming!

Glassdoor published a report on Wednesday that indicated that even as retail stores close, the retail industry is gaining ground in software jobs. It found that the retail industry increased 7.5% to 13.9% of software job postings since 2012. This was the highest industry segment of all, and over information technology companies, which came in second at 8.8% of job postings. Glassdoor attributes the growth of software-related jobs to the surge of online retail being driven by Amazon and WalMart. Notably, the manufacturing industry came in third, posting 6.1% of software jobs, with a push for leaner and smarter processing.Online Retail

Glassdoor predicted this uptick in software jobs last year, naming retail data scientist as a top 25 job for 2016. SAP’s extended supply chain executives stated that these hires would be critical, stating that, “It’s essential for not only collecting, managing and analyzing supply chain data, but also for garnering advanced predictive analytics to help executives make more intuitive, accurate and reliable decisions, allowing them to deliver goods and services ahead of the competition.” Retailers are searching for great candidates in this area, and they are hard to find because of the need for a mix of retail business acumen, technology skills, intuition and the math they need to bring to the role.

There are 2 succinct roles retail is trying to fill: the data engineer who gathers and collects the data, and the data scientist who takes value from that data and tries to understand the meaning of what the data is telling them. Because both roles need to be filled, retail typically tries to fill it with one person (extra difficult to find) or they outsource the jobs to other companies, like Accelerated Analytics. Accelerated Analytics can take the large volume of retail data and embed the analytics into usable reports that can be understood and acted on by people across the organization.

Sources: USA Today, CIO.com

Vera Bradley Lifestyle Brand Expands with Bedding Launch This Week

This Thursday, Vera Bradley launches its iconic styles into its first bedding collection. The collection of comforters, quilts, coverlets and pillows will simultaneously launch at select Bed, Bath & Beyond and Bon-Ton stores, on VeraBradley.com and in a pop up at its New York flagship store. Vera Bradley also owns its own stores, and because those stores are small in square footage, they will use virtual reality goggles in 10 stores to let consumers see the bedding in 3D room settings.

Vera Bradley is well known for its colorful cotton quilted styles of handbags. It has spent the last several years expanding its brand to luggage, accessories, footwear, gifts, jewelry, stationery and fragrances, updating marketing and bringing in new management to modernize its business and build it into a lifestyle brand. The launch is in time for school bedding for dorm rooms. “We’re constantly talking to our consumer about where the opportunities are for the brand and we heard that she really wanted us to expand into the home category,” said Robert Wallstrom, chief executive officer of Vera Bradley.

Vera Bradley uses Accelerated Analytics to track and analyze product and store sales and inventory at its major domestic retailers.

Source: Women’s Wear Daily

Consumers Will Shop In-Store During Back-to-School Shopping Season

The International Council of Shopping Centers’ (ICSC) annual “Back-to-School Spending” survey revealed good news for brick and mortar retailers earlier this month. Consumers are in search of the best back-to-school deals and promotions and are hitting their local shopping centers to find them.

This year, 89% of consumers will make their back-to-school purchases in local shopping centers and malls. A vast majority (69%) will shop at discount stores, followed by office supply stores (37%) and department stores (32%). Physical interaction with goods is the top reason for back-to-school shoppers to visit stores. Most important among these shoppers are:

  • The “ability to see, touch, or try on the merchandise” (46%)
  • The “ability to browse/ease of buying specific items” (36%)
  • The “convenience of one-stop shopping” (35%)
  • “Avoiding shipping fees” (34%)

Parents of children in K-12 are expected to spend an average of $309.60 while those shopping for college plan to spend an average of $437.80. Many will wait to start their shopping until they see advertisements or sale prices in stores and nearly 90% said they’re influenced by promotions in terms of the amount they spend and the items they purchase.

“Back-to-school is one of the shopping seasons where we really find people looking for specific items at the best price,” said Tom McGee, president and CEO of ICSC. “Consumers are more informed than ever and research prices and products prior to making a purchase so it isn’t surprising that so many shoppers are waiting for sales and discounts before buying their back-to-school items.”

Digital will play a role as well, this shopping season. A majority of consumers (81%) will utilize their mobile devices while in-store shopping for merchandise. Among this group, 58% will compare prices, 39% will download digital coupons, 38% will check availability/inventory, and 30% will take pictures of items that might be purchased.

Source: Chain Store Age

Vice President Pence Speaks at Retail Advocates Summit

Retail Advocates SummitThe NRF (National Retail Federation) hosted this year’s Retail Advocates Summit, which was visited by Vice President Mike Pence on Tuesday. He promised that the best days for American retailers are ahead. More than 200 retail representatives from across the US attended the annual conference, held in Washington, D.C.. The main focus for the conference this year was tax reforms for retailers and their employees.

“As retail goes, so goes America,” Pence said. “This president is going to work with this Congress, this year, and pass the largest tax cuts since the days of Ronald Reagan.” The current tax code creates “huge barriers” to creating more retail jobs, he added. Many retail executives had indicated the importance of obtaining a major reduction in the corporate tax rate, which is now at 35%. Pence suggested to the retailers a cut to 15%. He also mentioned that the estate, or death, tax will also be repealed. Retailers care about this due to some being held by families. There was a heavy round of applause to this news.

“Less regulation, lower taxes, better infrastructure,” he said. The president wants retailers to be able to compete on a “level playing field” with companies all across the world, he said. [We] “will put retailers back on the path to jobs and growth and back to competitiveness.”

Vice President Pence also acknowledged “You’re one of the great job producers in America”. The NRF had cited that retail supports one in four jobs in America.

Source: CNBC, NRF

Summer Retail Sales Low And Inventory Tracking a Problem

Retail sales fell in June overall, but not every segment of retail suffered. Sales at clothing and accessories stores decreased 0.1% in June and was unchanged in May. The decrease has been attributed to decreased pricing on products and low availability of inventory. Sporting goods stores also decreased in sales, by 0.6%. Online sales increased 0.4%, but consumers are being hit with emails that tell them the items they ordered online are being cancelled due to lack of availability. Retailers are struggling to get their single pool stock and sight into inventory location and availability in their reporting systems correct. Having a single pool stock in theory should make products available to any customer regardless of their shopping channel, and cut the amount of markdowns. But tight processes and reporting is needed to ensure stock is accurately reported and data collected is unified across all channels. Consumers are purchasing online, but then getting the email that some of the products are not available, but then another email asking to rate their purchases as if all the items were Retail Sales Inventory Trackingavailable – a telltale sign that data integration is not happening and a practice that leaves a bad taste in the mouths of customers. Segments that had decent sales at brick and mortar stores in June include general merchandise with 0.4% increases, building materials and supplies up 5%, and electronics and furniture both up 1%. This is in time for back-to-school college shopping that is coming in July and August. An uptick in college student enrollment is getting retailers to expect a record breaking back-to-school season. Combined back-to-school and back-to-college spending is expected to reach $83.6 billion, up more than 10% from last year. College consumers plan to spend $12.8 billion on electronics, $8 billion on clothing, $7.5 billion on snacks and food, and $4.5 billion on personal care items. Where do parents plan to buy? 57% say they will shop at department stores, 54% at discount stores and 46% at clothing stores and online.

Sources: Chain Store Age, NRF, Retail Weekly

Growing Demand and Tight Supply Lifting Home Prices

A decade after the onset of the Great Recession, the national housing market has, by many Data on the Housing Marketmeasures, returned to normal, according to the latest State of the Nation’s Housing report, being released today by the Joint Center for Housing Studies of Harvard University. Housing demand, home prices, and construction volumes are all on the rise, and the number of distressed homeowners has fallen sharply. However, along with strengthening demand, extremely tight supplies of both for-sale and for-rent homes are pushing up housing costs and adding to ongoing concerns about affordability (map + data tables). At last count in 2015, the report notes, nearly 19 million US households paid more than half of their incomes for housing (map + data tables).

National home prices hit an important milestone in 2016, finally surpassing the pre-recession peak. Drawing on newly available metro-level data, the Harvard researchers found that nominal prices were up last year in 97 of the nation’s 100 largest metropolitan areas. At the same time, though, the longer-term gains in real prices varied widely across the country, with some markets experiencing home price appreciation of more than 50 percent since 2000, while others posted only modest gains or even declines. These differences have added to the already substantial gap between home prices in the nation’s most and least expensive housing markets (map).

“While the recovery in home prices reflects a welcome pickup in demand, it is also being driven by very tight supply,” says Chris Herbert, the Center’s managing director. Even after seven straight years of  construction growth, the US added less new housing over the last decade than in any other ten-year period going back to at least the 1970s. The rebound in single-family construction has been particularly weak. According to Herbert, “Any excess housing that may have been built during the boom years has been absorbed, and a stronger supply response is going to be needed to keep pace with demand—particularly for moderately priced homes.”
Meanwhile, the national homeownership rate appears to be leveling off. Last year’s growth in homeowners was the largest increase since 2006, and early indications are that homebuying activity continued to gain traction in 2017. “Although the homeownership rate did edge down again in 2016, the decline was the smallest in years. We may be finding the bottom,” says Daniel McCue, a senior research associate at the Center.
Affordability is, of course, key. The report finds that, on average, 45 percent of renters in the nation’s metro areas could afford the monthly payments on a median-priced home in their market area. But in several high-cost metros of the Pacific Coast, Florida, and the Northeast, that share is under 25 percent. Among other factors, the future of US homeownership depends on broadening the access to mortgage financing, which remains restricted primarily to those with pristine credit.

Despite a strong rebound in multifamily construction in recent years, the rental vacancy rate hit a 30-year low in 2016. As a result, rent increases continued to outpace inflation in most markets last year. Although rent growth did slow in a few large metros—notably San Francisco and New York—there is little evidence that additions to rental supply are outstripping demand. In contrast, with most new construction at the high end and ongoing losses at the low end (interactive chart), there is a growing mismatch between the rental stock and growing demand from low- and moderate-income households.
Income growth did, however, pick up last year, reducing the number of US households paying more than 30 percent of income for housing—the standard measure of affordability—for the fifth straight year. But coming on the heels of substantial increases during the housing boom and bust, the number of households with housing cost burdens remains much higher today than at the start of last decade. Moreover, almost all of the improvement has been on the owner side. “The problem is most acute for renters. More than 11 million renter households paid more than half their incomes for housing in 2015, leaving little room to pay for life’s other necessities,” says Herbert.

Looking at the decade ahead, the report notes that as the members of the millennial generation move into their late 20s and early 30s, the demand for both rental housing and entry-level homeownership is set to soar. The most racially and ethnically diverse generation in the nation’s history, these young households will propel demand for a broad range of housing in cities, suburbs, and beyond. The baby-boom generation will also continue to play a strong role in housing markets, driving up investment in both existing and new homes to meet their changing needs as they age. “Meeting this growing and diverse demand will require concerted efforts by the public, private, and nonprofit sectors to expand the range of housing options available,” says McCue.

Source: Joint Center for Housing Studies