Author: Helen Thomas

Retail Sales Rose More Than Expected in May

According to the Commerce Department, U.S. retail sales rose 0.5% in May, beating a forecasted increase of just 0.3%. This followed a 1.3% increase in April and lifted sales 2.5% from a year ago.

The second straight month of gains was fueled by Americans purchasing automobiles and a range of other goods, suggesting economic growth despite a slowdown in job creation. Sales at clothing stores rose 0.8%, the largest gain in six months. Online retail sales, sporting goods and hobby stores all rose 1.3% last month and restaurant and bar sales climbed 0.8% Electronics and appliance outlets also saw a rise in sales with a 0.3% increase. Not everyone saw an increase in retail sales. Sales at building materials and garden equipment stores fell 1.8%, and furniture store sales dipped 0.1%.

The growth in retail sales could impact economist’s second quarter GDP growth estimates which are currently around a 2.5% annualized rate.

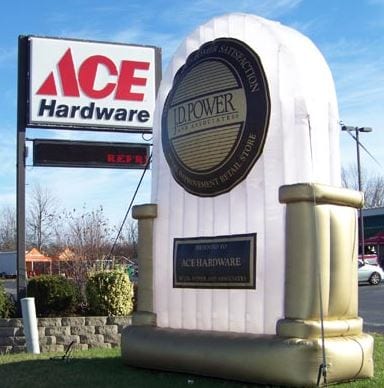
ACE HARDWARE RANKS #1 IN CUSTOMER SATISFACTION FOR THE 10th YEAR IN A ROW

The J.D. Power 2016 Home Improvement Retailer Satisfaction Survey awarded Ace Hardware top ranking for their 10th straight year. The study surveys 2,995 customers who purchased home improvement-related products from a home improvement retailer in the last 12 months, and was conducted in January and February 2016.

On a 1,000 point scale, Ace Hardware scored 810 in overall customer satisfaction, followed by Menard’s with a score of 803. Lowe’s placed 3rd at 799. The overall average across retailers was 795, up from 788 a year ago. The Home Depot was just at the average with 794. The study found that average drops significantly when an initial greeting in the store takes longer than 2 minutes. Customers also want the retailer to provide advice, and be able to answer their questions effectively in the store. “The retailer’s staff is most critical to differentiating the experience provided to customers, especially when it comes to the timeliness of greeting customers, answering their questions or providing advice,” said Greg Truex, senior director of the at-home practice at J.D. Power. “Retailers that train their employees to engage with customers proactively and assist them are more likely to provide them with a satisfying experience during these moments of truth.”

Ace scored 855 in staff and service compared to 811 average.

According to the Home Improvement Research Institute, home improvement consumer spend is on the rise, with an expected 4% increase this year to $332 billion.

Source: Chain Store Age, JD Power.com 

Takeaways from Accelerated Analytics’ GS1 Connect 2016 Session: ‘The Importance and Value of Data Sharing – Using Point-of-Sale Data to Deliver Outstanding Customer Experiences’

I had the opportunity to lead this session last week and came back with some takeaways that I wanted to share, as I feel they are reflective of the state of retail today and how retailers and vendors are using point-of-sale data to manage their business in this time of OMNI-channel, customer-experience driven retail.

Customers want a single-vision of brands and be able to have a consistent, complete and winning experience every time they shop, in whatever channel they shop in. To ensure products are available when and where the customer shops, retailers need real-time inventory visibility, a seamless order management system and the ability to deliver. Retailers and brands realize they need to work together to have both a single view of the customer and a single view of their data in order to be successful.

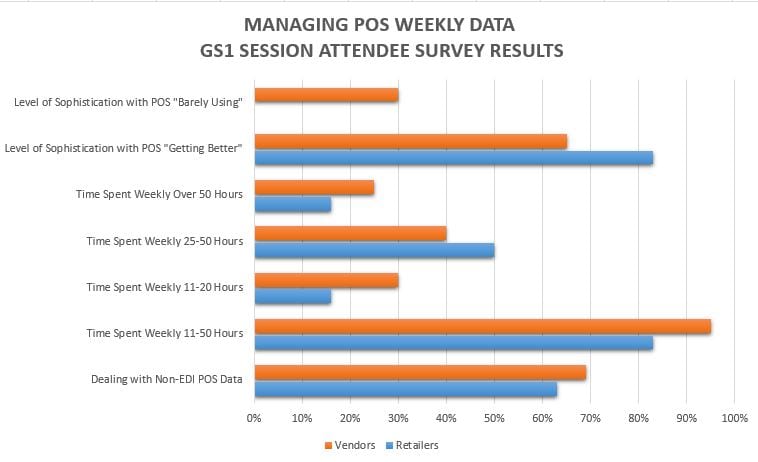
Some interesting, yet not surprising, statistics were gathered from the retailers and vendors represented in the room. When asked about managing their POS data week to week, 66% were using POS data that was not provided via an EDI 852 file, eliminating their ability to automate the collection and processing of the data electronically, and instead having to work with multiple sources and formats of data. This process of data management and then trying to create usable reports to have meaningful partnership conversations between retailer and vendor is extremely time consuming: 83% of the retailers in the room spend 11-50+ hours per week managing and processing their POS data. More staggering was 95% of the vendors in the session were spending 11-50+ hours per week: 30% spending 11-20 hours, 40% spending 25-50 hours and 25% over 50 hours per week!
Weekly POS Data

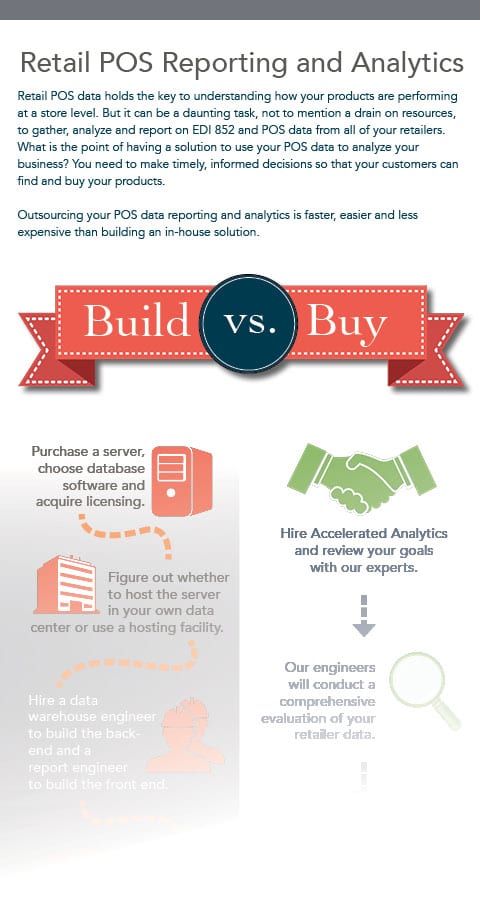
The good news is over half of the attendees in the room felt they are getting better at managing and using POS data each week, but 30% still admit to ‘Barely Using’ their POS data. Recognizing that heavy resources are needed to use POS data, especially on the vendor side, is making vendors ask, “Do we build an in-house solution to manage this, or outsource it?” Check out our infographic detailing the pros and cons of each, and the differences in resource and financial investment.

Based on the time and effort being made by most of those represented, it is clear that POS data sharing is important for effective collaboration between retailers and vendors to “get it right for the customer”. POS data can be used to not just track units sold overall, but can give product/store level details on out-of-stocks, weeks of supply, sell thru %, average sales, geographic trends, inventory investment and lost sales opportunities. CLICK HERE for our industry sell thru % guidelines infographic.

We need to do everything we can to exceed our customers’ expectations and deliver an outstanding experience for them when they come across our brand. Sharing POS data and then using it to partner together to analyze it will help shape the customers’ experiences and give us inventory visibility and fulfillment across channels to meet customer expectations.

Want to learn more? Contact Jennifer@AcceleratedAnalytics.com to start a conversation. CLICK HERE to download whitepapers on analyzing POS data like a pro.

– Jennifer Freyer, Director of Sales and Marketing, Accelerated Analytics


Five Below Exceeds Expectations

Specialty retailer Five Below had a strong first quarter, beating Wall Street projections for earnings and same-store sales over last year. Their net income for the first quarter of 2016 was $6.8 million, up an impressive 58% from the same time period last year. Net sales rose 25% from $153.7 million to $192.7 million.

We are very pleased with our first quarter results that once again demonstrate the universal appeal of Five Below and the disciplined execution of our key initiatives,” said Joel Anderson, CEO. “Our top-line outperformance was driven by continued strength at both our new and existing stores.”

Five Below opened 21 new stores in the first quarter of 2016 giving them 458 stores in 28 states.  They expect to open a total of 85 new stores this year, including 28 in the second quarter.

Net sales and net income are expected to continue to grow in the second quarter, with projected net sales in the $216 to $219 range and net income expected to reach between $8.5 and $9.2 million.

Source: Chain Store Age

How Millennials are Revolutionizing the Beauty Industry

For the multi billion-dollar beauty industry, appealing to millennial consumers – the largest generation in America – isn’t just a good idea, it’s crucial.

According to market intelligence agency Mintel, the beauty industry saw revenues of over $46 billion in 2015 and is projected to grow to over $51 billion by 2020. Women ages 18 to 34 are the biggest portion of the $13 billion dollar cosmetics market and they’re the most likely to be heavy buyers, meaning they purchase more than 10 types of products per year.

But, when it comes to beauty products, millennials are suspicious shoppers. Burned by stressful counter experiences and exaggerated magazine reviews, they’re distrusting. Their skepticism is impacting how, why and where beauty purchases happen, and the industry is evolving in response, effectively changing the way all consumers shop for beauty.  Here’s a summary of the changes you may notice:

Try Before You Buy

Product testing is vital to today’s beauty buyer. Online beauty purchases are down and stores like Ulta and Sephora, where trial stations and testers are the norm, are growing. According to a survey conducted by TABS Analytics, Ulta experienced a 41% increase in regular buyer purchases in 2015 compared to 2014. And Sephora reported a 25% increase in buyer penetration and a 32% increase in regular buyer purchases last year over the previous year. Clearly, consumers want to try before they buy. And retailers are listening as more offer samples and bring products out from behind counters.

A-La-Carte Beauty Solutions

According to the TBAS Analytics report the big brands, like Accelerated Analytics’ customers L’Oreal, Estee Lauder and Clinique, among others, are still going strong. What does seem to be changing is the belief that any one brand can provide all solutions to all of their problems. In other words, millennials like to have a choice. This means the door is opening wider for niche and specialty lines like Anastasia Beverly Hills which has seen significant growth. “The consumer has demonstrated a very high capacity to try and use multiple brands and that tendency seems to be growing over time,” says Kurt Jetta, Ph.D., CEO and lead product developer for TABS Analytics.

Fewer Sales People

While 90% of beauty purchases are still made at brick and mortar stores, today’s buyers are researching before they buy and thus taking the experience into their own hands. Beauty consumers are turning to online reviews, beauty blogs, YouTube, and the advice of friends prior to their purchases. All of this pre-purchase research boosts buying confidence and helps match expectations with reality, but it also means that the traditional makeup counter salesperson is becoming obsolete. They’re being relegated to a supporting cast member that shoppers only seek out when absolutely necessary.


Source: www.racked.com

Save

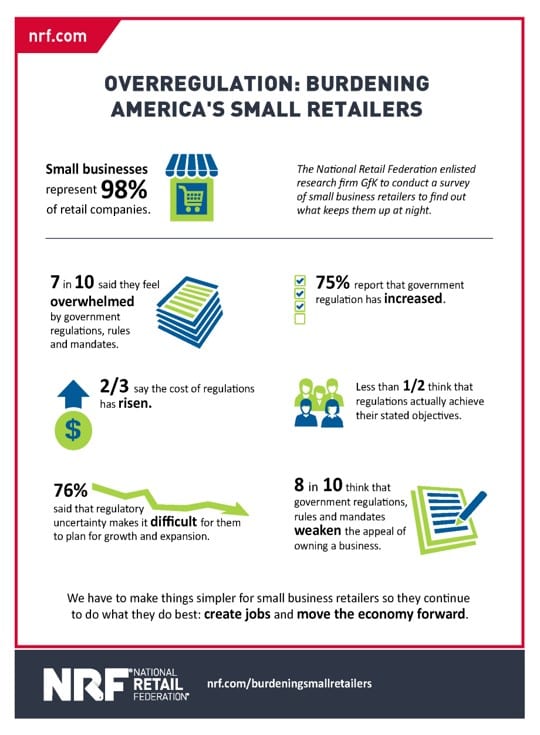
Overregulation: Burdening America’s Small Retailers

In an effort to gauge the views of small business retailers on the overall economic environment, the health of their individual businesses and the impact of public policies, the National Retail Federation commissioned a survey that was conducted online by GfK in December 2015 and January 2016.  752 small business owners participated and they represented a balance among demographic factors including gender, age, political ideology and geographic location.

The survey found that government regulation is a consistent point of difficulty for small retail businesses. Eight out of ten stated that government regulations actually weaken the appeal of owning a small business, and seven out of ten retail small business owners feel overwhelmed by rules and mandates on how they operate their business. The infographic below shows a sneak peak of the study and the full report is available on the NRF website at https://nrf.com/resources/retail-library/overregulation-burdening-americas-small-retailers.

Source: nrf.com

Build vs. Buy: Outsourcing your POS data-reporting and analytics is faster, easier and less expensive than building an in-house solution

Retail POS data holds the key to understanding how your products are performing at a store level. But it can be a daunting task, not to mention a drain on resources, to gather, analyze and report on EDI 852 and POS data from all of your retailers. Our newest infographic compares building an in-house solution to outsourcing your POS data-reporting an analytics. While there are beneifts to each approach, outsourcing the solution is faster, easier and less expensive. Complete the form below to request our FREE infographic!


US MANUFACTURING INDEXES TAKE A DIVE; STOCK LEVELS REACT

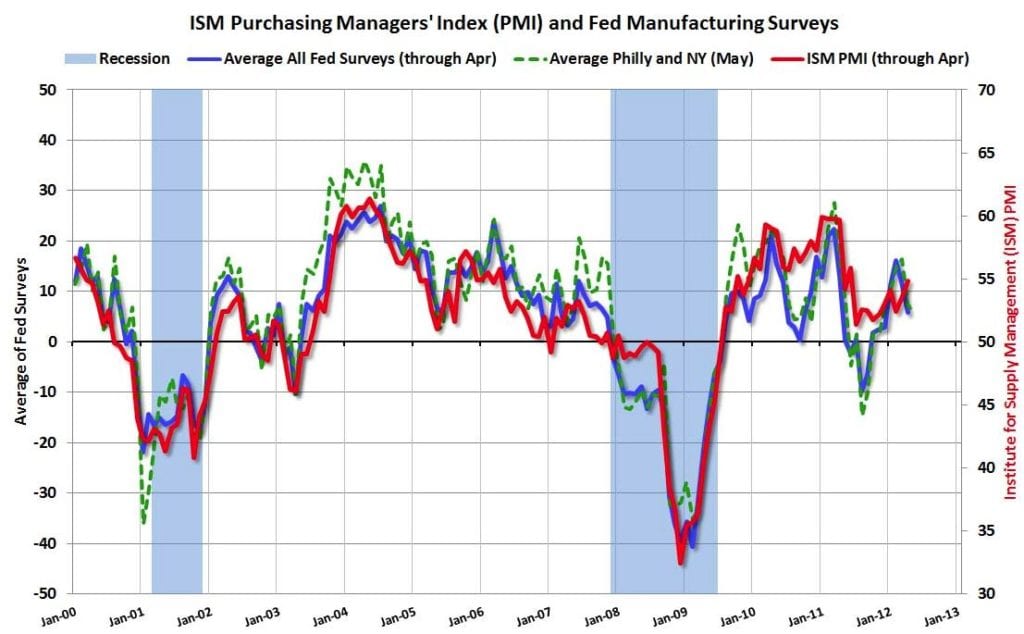
The New York Empire Manufacturing Index dropped to -9.02 from April’s positive 9.56 in May, missing estimates for a slight decline to positive 7.0. Stocks reacted negatively to the news, but were offset by gains in the energy and industrial sectors. Domestically oriented US manufacturers are seeing steadier business with bright auto, housing and job markets, while global manufacturers are struggling in markets from Brazil to Europe to China.

“Domestic demand is what has been supporting the manufacturing sector overall and preventing a sharper downturn,” said Gregory Daco, chief U.S. economist at Oxford Economics. “Domestic-oriented sectors are faring relatively well.”

Earlier in May, the Institute for Supply Management also reported its index results, but showed manufacturing activity already falling from March. A strong US dollar and low oil prices, plus weakness overseas, depressed demand for US exports.

The Philadelphia Federal Reserve also reported a decline in its index, reporting that mid-Atlantic manufacturing activity declined for the 8th time in 9 months.

These reports maintain the overall picture of sluggish economic growth, and a newfound possibility that the Federal Reserve could raise interest rates as soon as June.

Sources: WSJ, Nasdaq.com, Investors.com, CalculatedRiskBlog.com

CONGRATULATIONS 2016 GRADUATES! GRAD GIFT SPEND HIGHEST IN 10 YEARS!

The National Retail Federation (NRF) reports that 2016 graduation spending will reach a 10-year high this year, with spending expected to reach $5.4 billion. Americans celebrating high school and college graduations give special gifts, and retailers are offering a lot of options for the best gifts possible. Retailers will need to keep graduation gift items up front and in stock, and advertise locally for shoppers who look online before going shopping.

NRF’s 2016 Graduation Spending Survey revealed the average person buying graduation gifts will spend $106.45, up 3.9% from last year. Each individual graduate should not get too excited, though – the average shopper is buying for 2 graduates this year, so the spend is higher but spread out among more recipients.

Not helping retailers is the fact that cash is the most popular gift, given by 56%. Greeting cards, with the cash inside, will make up 39% of spend. This is followed by gift cards at 31%, clothing at 14% and electronics at 11%.

While the amount of spend averages $106.45, the age group of the gift giver makes a difference. Spending by those aged 45-54 will average $120.74, compared with $78.08 from those 18-24.

Source: NRF.com

HOUSING GAINS AND MILD WEATHER KEEP HOME DEPOT GOING STRONG

The Home Depot’s stock opened at a record-high level today, after announcing they topped first quarter expectations. Mild weather and a strong housing rebound are attributed to their successful first quarter. Revenue increased to $22.76 billion from $20.89 billion. Same store year over year sales rose 6.5% overall,up 7.4% in US stores.

Chairman and CEO Craig Menear said the company saw “week to week demand spikes caused by weather variability”. Home Depot originally forecasted 2016 earnings of $6.12 to $6.18 per share, with revenue predicted to increase 5.1-6% and same store sales to rise 3.7-4.5%. With its positive first quarter, Home Depot now predicts 2016 earnings of $6.27, sales to rise 6.3% and same store sales to rise 4.9%.

Having cited a strong housing rebound as another reason for a strong first quarter, steady growth for the housing market looks like it will continue. The National Association of Home Builders reported continued strong sentiment in May. Low mortgage rates are fueling demand that have boosted expectations for home sales in the next six months to the highest level of the year. More housing data is due out later this week, including housing starts and existing home sales.

Source: US News & World Report, Wall S. Journal