Author: Helen Thomas

Predictive Analytics and Machine Learning: No, they’re not the same thing

By now, most companies know that data is an indescribably valuable resource for supporting smart decision-making and enhancements in business operations. As data, and its uses, continue to evolve, a growing number of businesses are embracing predictive analytics to expand data’s benefits on a massive scale.

Predictive Analytics = Machine Learning?

In short, no. Although they work hand-in-hand, predictive analytics and machine learning are not exactly the same thing. Let me explain.

Recommended for you Machine learning is defined as a subset of artificial intelligence in which processes are automated by using sample data and pattern recognition to enable systems to carry out tasks without being specifically programmed to do so. Machine learning uses algorithms to build models to make predictions without the need for human supervision. These algorithms are used in many automated tasks, such as email filtering and network security, and uses iterative processes to continue to learn and independently adapt when provided with new data. It’s not a new concept by any means, but it is one that has been refreshed, evolved and become more useful than we could have imagined only two decades ago. Your shopping suggestions, based on what you’ve looked at or bought before? Targeted ads? Your Netflix and Pandora feeds? They’ve all been developed through machine learning, using the input from you to learn your patterns and preferences in order to accurately recommend products, services and entertainment tailored to you

Peer into the crystal ball Machine learning resides underneath the umbrella that is predictive analytics, which, along with other statistical techniques, such as data mining, and uses established patterns to identify likely future outcomes. The predicted outcomes could include consumer behaviors, market fluctuations, credit worthiness and more. Predictive analysis is used in industries across the board, from marketing to insurance, telecommunications to credit score calculation, even healthcare.

So, predictive analytics, as more of a concept than an operation, predicts outcomes based on historical statistical data while machine learning is a process – the result of evolution in pattern recognition. The models which are created eventually ‘learn’ to make accurate decisions backed by the algorithmic data it processes.

Predictive analysis software solutions use built-in algorithms to create predictive models. The algorithms – classifiers – indicate what categories the data belongs to.

The most commonly-used predictive models are neural networks, decision trees and logistic regression. Modeled after the the human brain’s neurological processes, neural networks are used to solve complicated patterns and are extremely helpful in analytics involving large data sets. They are able to decipher nonlinear relationships, even if some of the variables are unknown. Decision trees are produced by algorithms to analyze data by grouping it into branch-like subsets based on input variables, effectively tracing the path of ‘thought’ leading to a decision. Regression analysis works to identify patterns and relationships in large, diverse sets of data.

Less-common classification algorithms include time series analysis – a series of data points indexed in time order; cluster analysis – grouping like variables together; and outlier detection (also known as anomaly detection). Furthermore, algorithms can be used together to achieve better predictions than by using one lone algorithm; these combined algorithms are called ensemble models.

These unique classifiers approach data in different ways, so to get the needed results, the right classifiers need to be put into use.

How does predictive analysis help you win at retail?

No matter how much data an organization generates, if it can’t be properly utilized, that data is rendered useless as an untapped resource.

Enter EDI 852 Your EDI 852 data can tell you a lot about your business. Some insights provided by your EDI 852 include:

Items out of stock, almost out of stock, or overstock, measured in units on hand. By isolating each of your items at a store level and applying filtering for your desired min/max inventory position, you can quickly determine an average units sold during a specified time frame, then use this to calculate inventory weeks (or days) supply on-hand. Supply on-hand is a predictive indicator that will identify trends and alert you to take action if/when needed.

Top- and bottom-selling items. Obviously this is measured in units sold. Identifying top items at a store-by-store level over time will uncover trends in consumer behavior and preferences that are helpful in knowing what items to continue (or discontinue) carrying and at what price points the items sell the best/worst. These predictions will help you make smart decisions regarding ordering, stocking, scheduling, plan-o-grams, and more factors that affect your bottom line.

Period-over-period and regional comparisons. Comparing sales and inventory for similar periods of time and by geographic region will help you adjust your inventory min/max. Using algorithmic predictions, your analytic software can automate some, if not all, of these processes.

Most EDI 852 data arrives with very basic measures for units on-hand and units sold. By creating the right ensemble models of algorithms, analytic solutions can do the EDI 852 translation, database storage and number crunching, meaning your focus can remain on growing your team and improving your bottom line.

What Is Cost Of Goods Sold?

COGS - Cost of Goods Sold acronym, business concept on blackboard

What Is Cost of Goods Sold – COGS?

Cost of goods sold (COGS) refers to the direct costs attributable to the production of the goods sold in a company. This amount would include the cost of materials used in creating the goods as well as direct labor costs used to produce those goods. What would be excluded includes indirect expenses, such as distribution costs and sales force costs.

You may also hear cost of goods sold referred to as “cost of sales.”

Inventory that is sold normally appears in your income statement under your COGS account. The beginning inventory for the year is the inventory left over from the previous year, which would be the merchandise that was not sold during the prior year. Any additional productions or purchases made by the manufacturing or retail company would be added to the beginning inventory. At the end of the year, products that have not been sold would be subtracted from the sum of beginning inventory and additional purchases. That final number from the calculation would be your cost of goods sold for that year.

Balance sheets have an account known as the current assets account. Under this account is an item called inventory. The balance sheet only captures a company’s financial health at the end of an accounting period. This means that the inventory value recorded under current assets is the ending inventory. Since the beginning inventory is the inventory that a company has in stock at the beginning of its accounting period, it means that the beginning inventory is also the company’s ending inventory at the end of the previous accounting period.

What Will COGS Tell You?

There’s no question about it, COGS is an important metric on your financial statements. COGS is subtracted from a your revenue to determine the gross profit of your company. The gross profit is a profitability metric that is used to evaluate how effective a company is with managing labor and supplies production.

Since COGS is a cost of doing business, it’s recorded as a business expense on your income statements. Knowing the cost of goods sold allows investors, analysts and executives the ability to estimate a company’s bottom line. If COGS increases, net income goes down. While it’s beneficial for income tax purposes, the business will have less profit for shareholders. This is why companies try to keep cost of goods sold low so that profits will increase.

Cost of goods sold (COGS) is the cost of acquiring or manufacturing the products that a company sells during a period, so the only costs included in the measure are those that are directly tied to the production of the products, including the cost of labor, materials, and manufacturing overhead. For example, the COGS for an automaker would include the material costs for the parts that go into making the car plus the labor costs used to put the car together. The cost of sending the cars to dealerships and the cost of the labor used to sell the car would be excluded.

Furthermore, costs incurred on the cars that were not sold during the year will not be included when calculating COGS, whether the costs are direct or indirect. In other words, COGS includes the direct cost of producing goods or services that were purchased by customers during the year.

As a rule of thumb, if you want to know if an expense falls under COGS, ask: “Would this expense have been an expense even if no sales were generated?”

Accounting Methods and COGS

There’s 3 methods that a company can use when recording the level of inventory sold during a period:

  • First In, First Out (FIFO)
  • Last In, First Out (LIFO)
  • The Average Cost Method

FIFO – The earliest goods to be purchased or manufactured are sold first. Since price points generally go up over time, companies that uses the FIFO method will sell the least expensive products first. By doing so, you get a lower COGS than the COGS recorded under LIFO. Due to this, the net income using this method would increase over the duration.

LIFO – The latest goods added to the inventory are sold first. During periods of rising prices, goods with higher costs are sold first, leading to a higher COGS amount. With this method, the net income tends to decrease over time.

Average Cost Method – The average price of all goods in stock, regardless of what date they were purchase, would be used to value the goods sold. Taking the average product cost over a set period will usually deter COGS from being highly impacted by extreme costs.

COGS Deductions And Exclusions

A majority of service companies do not have any cost of goods sold at all. COGS is not an accepted accounting principle (GAAP), but COGS is clearly defined as only the cost of inventory items sold during any period.  If COGS is not listed on the income statement, no deduction would be applied for those costs.

Examples of pure service companies include marketing consultants, business consultants, accounting firms, law offices, real estate appraisers, professional dancers, etc. Even though all of them have business expenses and normally spend money to provide the services they offer, they don’t list COGS. Rather, they have what is called “cost of services,” but it doesn’t count toward COGS deductions.

Cost Of Revenue And COGS

Costs of revenue exist for contract services that can include direct labor, shipping costs, raw materials and commissions paid to a sales team. These items will not be able to be claimed as COGS without a physically produced product to sell.

Many service-based businesses do have some products they sell. Let’s look at a few examples. Airlines and hotels primarily provide transport and lodging respectively, but they also can sell gifts, food, beverages and books. These items are definitely considered goods and these companies have inventories of those goods. Both of these industries can list COGS on their income statements and claim them for tax purposes.

Operating Expenses And COGS

Operating expenses and cost of goods sold (COGS) are expenditures that companies incur while running their business. However, these expenses need to be segregated on your income statement. Unlike COGS, operating expenses (OPEX) are expenditures that are not directly tied to the production of goods or services. Typically, SG&A (selling, general, admin expenses) are included under operating expenses as a separate line item. SG&A expenses are expenditures that are not directly tied to a product, such as overhead costs. Examples of operating expenses include the following:

  • Renting
  • Utilities
  • Insurance costs
  • Sales and marketing
  • Office supplies
  • Legal costs
  • Payroll
  • Limitations of COGS


COGS can easily be manipulated by accountants or managers looking to cook the books. It can be altered by:

  • Allocating to inventory higher manufacturing overhead costs than those incurred
  • Overstating discounts
  • Overstating returns to suppliers
  • Altering the amount of inventory in stock at the end of an accounting period
  • Overvaluing inventory on hand
  • Failing to write-off obsolete inventory
  • When inventory is artificially inflated, COGS will be under-reported which, in turn, will lead to higher than the actual gross profit margin, and hence, an inflated net income.

Investors looking through a company’s financial statements can spot unscrupulous inventory accounting by checking for inventory buildup, such as inventory rising faster than revenue or total assets reported.

How You Can Use COGS

As an example, let’s calculate the cost of goods sold for Company XYZ for fiscal year (FY) ended 2018. The first step is to find the beginning and ending inventory on the company’s balance sheet:

  • Beginning Inventory: Inventory recorded on the fiscal year ended 2017 = $2.72 billion
  • Ending Inventory: Inventory recorded on the fiscal year ended 2018 = $2.85 billion
  • Purchases During 2016: Using the information above = $8.2 billion

Using the COGS formula, you would get the following;

$2.72 + 8.2 – 2.85 = $8.07 billion

If we look at the company’s 2018 income statement, we see that the reported COGS is $8.07 billion.

*Accelerated Analytics publishes resources like this to provide insights to different analytical metrics, data points and formulas. POS Analytics. Please be aware, this doesn’t mean that our product will this metric, data point or formula. To learn exactly what our reporting covers, please feel free to schedule a demo or give us a call. Thanks for understanding.

12 Inventory Management Strategies To Manage Inventory Like A Boss

Inventory Management Strategies

It’s always important to evaluate your company on a regular basis to ensure you’re hitting your goals. While this is true for every type of business, in retail, it’s vital to your success. One of the most important departments for any retailer is inventory management. Managing inventory is vital to the success of your business as “inventory” is often the biggest investments companies have. Due to this, you want to make sure you’re using inventory management strategies that can help you master your inventory and grow your company.

Ask yourself, “how well is our inventory management?” Do you have the right products at the right time? Are you experiencing stock outs? Is your inventory arriving in time to avoid empty shelves? Inventory control is an art and as inventory is likely one of the biggest investments your company has, it’s essential you get it right.

What Is Inventory Management?

Inventory management is one component of your supply chain that focuses on having the right products, the right quantity of products and selling those products at the right time. When done correctly, inventory management helps you reduce the costs associated to carrying excessive inventory. It also allows to maximize your sales, which is super important for everyone.

By effectively managing your inventory you can have the right products in the right quantity on hand and avoid products being out of stock and funds being tied up in excess stock. You can also ensure your products are sold in time to avoid spoilage or obsolescence, or spending too much money on stock that’s taking up space in a warehouse or stockroom.

The Right Inventory Management Software

The right inventory management software is going to allow you to;

  • Improves cash flow, reduce cost and boost your bottom line
  • More accurately forecasting demand
  • Prevent excess stock and too many raw materials
  • Keep track of your inventory in real time
  • Optimizing your warehouse and employee hours
  • Preventing product and production shortages
  • Allows for easy inventory analysis on any type of device
  • Being accessible right from your retail point-of-sale
  • Offer quick and painless bar code scanning to speed up intake
  • Using multi-location management, tracking inventory across several locations or warehouses
  • Inventory management techniques and best practices for small business types

Here are some of the techniques that many small businesses use to manage inventory:

Inventory Management Strategies

(1) Fine-Tune Your Forecasting – Accurate forecasting is vital. Your projected sales calculations should be based on facts,  such as your historical sales data (this could be from your POS), market trends, predicted growth of economy, promotions, marketing efforts, sales, etc.

(2) Identify Low-Turn Stock – If you have stock that hasn’t sold in the past 6 months, 12 months, it’s likely time to stop stocking those items. You may also want to consider using different strategies to get rid of that stock — like a special promotion or discounts. Excess stock does you no good if it’s not selling, just a waste of space and capital.

(3) Evaluating Your Stock – Even with the right inventory management software,  you still need to take the time to count your inventory to make sure what you have in stock matches what you think you have. We see businesses make the mistake of not counting their inventory and relying on what the software says only to find out later that their inventory is off. Companies use a lot of different techniques to keep inventory accurate, including annual year-end physical inventory counts for all items.

(4) The FIFO Approach (first in, first out) – Goods should be sold in the same chronological order as they were purchased or created. This is especially important for perishable products like food, flowers, and makeup. A bar owner, for example, has to be cognizant of the materials behind the bar and apply FIFO methods to improve bar inventory. It’s also a good idea for nonperishable goods since items sitting around for too long might become damaged, or otherwise out of date and unsellable. The best way to apply FIFO in a storeroom or warehouse is to add new items from the back so the older products are at the front.

(5) Quality Control – No matter your specialty, it’s important to ensure that all your products look the best they can and all are working. This could be as simple as having employees do a quick exam during stock audits that includes a checklist to check for specific things. Quality control matters.

(6) Cloud-Based Inventory Management Software – Look for software with real-time sales analytics. We can’t stress this enough. You want inventory management software that has real-time analytics so you can see how your inventory is moving at all times.

(7) POS Reporting – Your POS data can give you a ton of powerful insights that will allow you to grow your company. Here at Accelerated Analytics, our POS analytics allows you to seamlessly track your sales across multiple locations and see how inventory is moving through those locations as well.

(8) Tracking Stock Levels – You want to make sure you have a solid system in place for tracking stock levels, prioritizing the most expensive products. The right software can save you time, effort and money by doing all the heavy lifting for you.

(9) Hire A Stock Controller – Stock control is used to show the amount of inventory you have at any given time and applies to all items, from raw materials to finished goods. For those of you that have a lot of inventory, you may need one person to be responsible for all of it. We call them a stock controller. They can process purchase orders, receives deliveries and makes sure that everything coming in matches what has been ordered.

(10) ABC Analysis – Many businesses find it helpful to have tighter controls over higher-value items by grouping inventory items into A, B, and C categories. Learn more about ABC Analysis.

(11) Consider Drop Shipping – If your business chooses to use drop shipping methods, you can sell products without physically holding the inventory yourself. With you out of the equation, a wholesaler or manufacturer would be responsible for carrying the inventory and shipping those products out to consumers when they make a purchase from your store. Drop shipping models have a lot of benefits, use them wisely.

(12) Big Ticket Products — While these items will make up the smallest percentage of inventory you have, they do account for the largest annual consumption value. Products grouped into the C category , which are the least expensive items you have, these will make up the largest percentage of inventory but will have the lowest annual consumption value. B products play in the middle. Their annual consumption value is annual demand multiplied by an item’s cost.

*Accelerated Analytics publishes resources like this to provide insights to different analytical metrics, data points and formulas. POS Analytics. Please be aware, this doesn’t mean that our product will this metric, data point or formula. To learn exactly what our reporting covers, please feel free to schedule a demo or give us a call. Thanks for understanding.

Supply Chain Efficiency

Supply Chain Efficiency

If you know anything about supply chain management, you already know how vital it is to run your supply chain efficiency. We’ve discussed this very thing in our article on logistics management. There’s a lot of working pieces to a supply chain.

Supply chains have multi-levels and can give your company a big competitive advantage over your competition. In order to improve supply chain management efficiency and effectiveness, companies must be able to;

  • Improve Reliability
  • Improve Predictability
  • Optimize Costs
  • Mitigate Risk
  • Analyze Data

When companies can strategically improve in these areas of the supply chain, it can create a momentum wave in your business. A successful supply chain is one that helps businesses save money, faster delivery time, improved customer service, shorter factory processing time, better inventory management and the list goes on.

What Is Supply Chain Efficiency?

Let’s get back to the basics. Supply chain efficiency is an organization’s core standard of performance as it pertains to their supply chain.

Efficiency measures the ratio of work performed in a process of some type, whether the process is using best practices or using the best resources. Due to this, supply chain efficiency doesn’t always guarantee effectiveness. A supply chain might efficiently reduce costs, but if the end consumer is unhappy with the product, it is ineffective. Now that you know that, an effective supply chain focuses on the outcome and external standards, AKA “results.”

Well-built supply chains can do a lot of great things, such as improving margins, expansion and growth, increase positive consumer experiences and reduce your operating costs. Determining the best way to move a product to its destination takes careful planning of optimizing order processing, receiving procedures, outbound schedules and reverse logistics.

Distribution Networks In Supply Chain Efficiency

A distribution network is a system a company uses to get products from the manufacturer to the retailer. Companies that are able to leverage the supply chain as a strategic capability have the ability to create a durable distribution network. As you likely know, a quick reliable network is a competitive advantage because customers are able to get products whenever they want them. It makes your company shines and customers love having that option, it’s a win-win for everyone involved.

Today, the trend is for distribution centers to be located close to major markets in order to reduce inbound and outbound miles. Every company choose location based on strategic research. Having the ability to get products to customers within 24 hours is the future. Today, that shipping option is available and those companies are reaping the reward.

How To Improve Supply Chain Management Efficiency?

For a supply chain to be efficient, companies must create reliable transportation solutions.

A transportation network empowers a company to reduce shipping costs and increase customer service levels. The good news, they can do this with little disruption to any processes. An effective transportation network starts with shipment visibility. Visibility improves routing, capacity and profitability.

This is exactly why you see a lot of shippers working with 3PLs (Third-Party-Providers) to explore new transportation solutions. The data and stats prove how effective a 3PL company can be. 75 percent of 3PL users say 3PLs provide new and innovative ways to improve logistics effectiveness. The most frequently outsourced logistics activity is domestic transportation (80 percent). Regardless of what mode is used or freight volume, 3PLs do have a lot to offer a company.

If you’re a shipper, you should be thinking about analyzing the existing supply chain processes, distribution network, and transportation solutions in your supply chain. Looking at current and predicted delivery lead-times, logistics expenses, and inventory assets are good data points to find a path to efficiency and effectiveness.

*Accelerated Analytics publishes resources like this to provide insights to different analytical metrics, data points and formulas. POS Analytics. Please be aware, this doesn’t mean that our product will this metric, data point or formula. To learn exactly what our reporting covers, please feel free to schedule a demo or give us a call. Thanks for understanding.

What Is Logistics Management?

Logistics Management

Logistics management is a term that’s well known in the retail industry and supply chain. It’s a supply chain management component that’s used to meet customer demands through the control, planning and implementation of the effective movement and storage of related information, goods and services from origin to destination. Logistics management has a wide range of benefits that help companies reduce expenses and improve customer service.

The logistics management process begins with raw material accumulation, ending in delivering goods to the final destination.

By adhering to customer needs and industry standards, logistics management facilitates process strategy, planning and implementation.

Logistics management includes a lot of working components, which include:

  • Choosing the right vendors with the ability to provide transportation facilities
  • Selecting the most effective routes for transportation
  • Finding the most competent delivery method possible
  • Leveraging automation, software and IT resources to build seamless processes
  • Building strong relationships that benefit all parties involved

All 5 of these are vital to effective logistic management.

Bad Logistics Management

In logistics management, bad decisions and bad choices can create a lot of problems for your business.

For example, if you have deliveries that fail or take long amounts of time to be delivered, it can quickly ruin your customer service. A few bad reviews and people may be scared to buy from your company. With the access social media provides today, it doesn’t take but one bad scenario to cause a big headache. Every customer needs to be treated as a priority because in all realty, your company may depend on it. If you want great customer service, every customer must be treated as a priority.

Damaged goods caused by careless transportation is another big issue that can hurt your bottom line. If you’re buying something new, the last thing you want is a damaged product. You need to exercise caution with fragile products, ensuring they’re well packaged and safe for travel. You always want to expect the unexpected, so make sure products are safely wrapped and can withstand a rough ride through transport just in case it happens.

Bad logistics planning can be yet another problem your company can face. It can increases your expenses and issues can arise from implementing ineffective logistics software. While a lot of these issues occur due to improper decisions related to your outsourcing, having the wrong vendors in place can seriously hurt your company.

Great Logistics Management

On the other hand, having the right vendors can give your business and bottom line a big positive boost.

To resolve these concerns before they occur, organizations have to focus on implementing the best logistic management practices possible. Companies should focus on great collaboration versus competition. Good collaboration can go a long way among transportation providers, buyers and vendors helps reduce expenses. An efficient and safe transportation provider is also vital to the success of your company.

Effective logistics management would be incomplete without proper warehouse management. Warehouse operations are considerably dependent on the type of goods that are being stored.

When it pertains to perishable goods, such as dairy products like milk, these products must have refrigeration. While grains don’t need a fridge, they do need to be stored in a moisture free environment. The logistics firm should always aim at developing the warehouse inventory so that there is minimum wastage of goods.

Also, you want to maximize the storage capacity of the warehouse. Many warehouses use vertical storage columns to save space and store more goods. Effective implementation of the right software and automation for sequencing the products is necessary so there’s no delays.

In total, there’s many components to a successfully implementing logistics management. It takes a team approach from everyone involved to operate efficiently every day of the year.

*Accelerated Analytics publishes resources like this to provide insights to different analytical metrics, data points and formulas. Please be aware, we’re not claiming that our POS reporting services will offer this example or any other metric, data point or formula. To learn exactly what our reporting covers, please feel free to schedule a demo or give us a call. Thanks for understanding.

What Is ABC Analysis?

ABC Analysis

ABC analysis is an approach that allows you to assign classes to inventory items based on that items’ consumption value. If you don’t know what that is, consumption value is the total value of an item consumed over a specified time period, which could be a year or month. This approach is based on the Pareto principle (the marketers will know that one) to help manage what’s important and this is how it’s done;

  • A Items – These refer to goods where annual consumption value is at the highest. Applying what is called the Pareto principle (also referred to as the 80/20 rule where 80 percent of the output is determined by 20 percent of the input), they comprise a relatively small number of items but have a relatively high consumption value. This is a logical analysis and control of this class can be extremely beneficial as these items have the greatest potential to reduce costs or losses.
  • B Items – This is going to be interclass items. B consumption values are lower than A items but higher than C items. A key point of having this interclass group is to watch items close to A item and C item classes that would alter their stock management policies if they edge closer to a higher class or lower class. Stock management is a cost, so there needs to be a balance between controls to protect the asset class and risk of loss, or the cost of analysis and the potential value returned by reducing class costs. The scope of this class and the inventory management procedures are determined by the estimated cost-benefit of class cost reduction and loss control processes.
  • C Items – These have the lowest consumption value. This class has a relatively high proportion of the total number of lines but often has low consumption values. In most cases, it’s not cost-effective to use tight inventory controls, this is due to the value and risk associated to the items.

Since no two businesses are completely alike, the threshold that defines the upper and lower limits of each class are not definable, nor would they be fixed over time or across multiple locations. You wouldn’t have the same “risk” at every location. A business will likely have different risk between multiple locations.

Just to give you an example, think about a location that has a high-crime rate and most of the inventory stored there is A Items. This is why you want your management accountant carrying out risk and stock management cost-benefit analysis by location to deliver the optimal overall cost-benefit balance and to set the appropriate ABC ranges.

What Benefits Does ABC Analysis Provide?

  • It gives you better control over your high-value inventory items while helping reduce losses and costs.
  • Gives you more efficient use of stock management resources.
  • Relatively low value of B or C class holdings can allow a business to hold bigger buffer stocks to reduce stock outs.
  • Fewer stock outs are going to result in better production efficiency.
  • Fewer stock outs and improved production efficiency resulting in more reliable cycles, enhancing customer experience.

Questions For Implementing ABC Inventory Management

  • Is there reliable and accessible cost and demand information by item?
  • Will your inventory management systems and processes facilitate efficient operations with the ABC concept?
  • Have the costs and benefits of implementing and operating ABC been quantified?
  • Are you properly planning for implementing ABC?

If you’re going to leverage the ABC concept and implement it into your business, it must be carefully planned for. Make sure you’re asking the right questions, make sure you understand the benefits for using this ABC system.

*Accelerated Analytics publishes resources like this to provide insights to different analytical metrics, data points and formulas. POS Analytics. Please be aware, this doesn’t mean that our product will this metric, data point or formula. To learn exactly what our reporting covers, please feel free to schedule a demo or give us a call. Thanks for understanding.

What Is Just In Time Inventory Management?

JIT Just in Time

Inventory management plays a key role in all areas of your business. Just in time inventory is no different.

Just in time inventory, also referred to by JIT inventory, is the reduced amount of inventory owned by a business after it installs a just-in-time manufacturing system. This type of system is a term defined as a “pull” system. The purpose of this JIT system is to ensure that the components and sub-assemblies used to create finished goods are delivered to the production area exactly on time. By following this JIT inventory system, you can eliminate a large amount of your investment in inventory, which will help you reduce the working capital your business ultimately needs.

By using the just in time concept, inventory may be reduced by the following means:

  • Reduced Production Runs – When you can set up your equipment quickly, you make it more economical to create short production runs. In return, this reduces the investment in finished goods inventory.
  • Compressing Operations – When production cells are arranged close together, there’s less work-in-process inventory being moved between cells.
  • Production Cells – Employees are known to walk individual parts through processing steps in a work cell, which helps you reduce scrap levels. Doing this can also help you eliminate the work-in-process queues that typically build up in front of a specialized work station.
  • Certification – Supplier quality is certified in advance, so those deliveries can be sent straight to the production versus piling them up in the receiving area for inspection.
  • Delivery Quantities – Deliveries are made with the smallest possible quantities, possibly more than once a day, which nearly eliminates raw material inventories.
  • Local Sourcing – When suppliers are located close to a company’s production facility, this shortened distance makes it much more likely that deliveries are made on time, which reduces the need for safety stock.

What Are The Advantages Of JIT Inventory

There’s a number of different advantages that come from using JIT inventory, especially in relation to reduced cash requirements and the ease of uncovering manufacturing problems. Besides the obvious, here’s a few more advantages for just in time inventory.

  • Working Capital – Just in time inventory is designed to be exceedingly low, so the investment in working capital is minimized as much as possible.
  • Process Time – When the just in time system is implemented correctly, it should shorten the amount of time required to manufacture products. In return, this can decrease quoted lead times given to customers placing orders.
  • Obsolete Inventory – Since inventory levels are so low, there is little risk of having much obsolete inventory.
  • Lower Scrap Cost – With a small amount of inventory on hand, all defective inventory items are more easy to identify and correct, resulting in lower scrap costs.
  • Engineering Change Orders – It is much easier to implement engineering change orders to existing products, because there are few existing stocks of raw materials to draw down before you can implement changes to a product.
  • Process Time – A thoroughly implemented JIT system should shorten the amount of time required to manufacture products, which may decrease the quoted lead times given to customers placing orders.

Disadvantages To JIT Inventory

While there’s not many disadvantages to JIT inventory, there is one big one.

  • Shortages – Low JIT inventory levels make it more likely that any problem in the supplier pipeline will lead to a shortage that will stop production. This risk can be mitigated through the use of expensive overnight delivery services when shortages occur.

Evaluation of JIT Inventory

The benefits of reducing the investment in inventory are substantial, which can lead a company to pare away too much inventory. When this happens, any unanticipated disruption to the flow of materials can bring operations to a halt almost immediately. Consequently, JIT concepts should certainly be followed, but be aware that there is a lower limit on how far you can reduce inventory levels.

Here’s 3 big brands that use just in time inventory.

Apple – This consumer electronics giant keeps as little inventory on hand as possible. By lowering the amount of stock on hand, Apple carries a lower risk of overstocking and chalking up dead stock in its warehouses.

Kellogg’s – It’s no secret that Kellogg’s produces a lot of perishable goods, so no surprise that they use the Just in Time inventory management method as a strategy for their stock management system. Kellogg’s makes sure that enough products are made to fulfill orders and limited stock is kept on hand.

Tesla – Despite the incredible growth rates of Tesla, the company continues to be one of the smallest auto manufacturers in the world. In contrast, Tesla takes complete ownership of the supply chain and has been vocal in their rejection of the traditional franchise-dealer sales model.

*Accelerated Analytics publishes resources like this to provide insights to different analytical metrics, data points and formulas. Please be aware, we’re not claiming that our POS reporting services will offer this example or any other metric, data point or formula. To learn exactly what our reporting covers, please feel free to schedule a demo or give us a call. Thanks for understanding.

What Is Wholesale Distribution?

Wholesale Distribution

If you’ve ever shopped on the internet to buy a product, it’s highly likely the product you purchased wasn’t produced by the retailer you purchased it from. Many businesses throughout the world use wholesale distribution sources to buy products in bulk (usually discounted) and they turn around to sell them to customers.

Product supply chains have middlemen between manufacturers and consumers, these “middlemen” are usually wholesale distributors.

What Is A Wholesale Distributor?

A wholesale distributor is a person or company that buys products in bulk quantities directly from manufacturers and redistributes the products, most commonly to retailers.

There’s 3 key pillars to the supply chain, the manufacturer, the wholesale distributor and retailers. All three interact in different manners, here’s how;

  • A manufacturer is the one that makes the products they sell and often lacks the time or resources to put those products in the market.
  • Wholesale distributors purchase directly from manufacturers in bulk and at low prices, then they distribute those products to the next link in the chain, usually a retailer.
  • The retailer sells directly to customers.

Each link in this chain sells the product for a slightly higher price than the last, hence the way each can make profit.

How Does Wholesale Distribution Work?

In simple terms, the wholesale distributor is the middleman between the manufacturer (produces the products) and the retailer (who sells those products). Wholesalers that use dropshipping will ship items directly to the customer, as directed by the dropshipping seller.

Now, some distributors may be associated with the manufacturer under the same company. Other distributors have a partnership with manufacturers.

The “big idea” behind wholesale distribution is buying high-demand products at a low price. After all, that’s how they make their money. Low prices can be achieved but the volume has to be high. By purchasing products in bulk, wholesale distributors can usually get a great deal from manufacturers. In most cases, manufacturers don’t have the resources or bandwidth to sell a lot of product. Rather than investing time, money and effort trying to sell their products, they can reach out to wholesale distributors, give them a good price and sell it in large quantities at once.

Wholesale distributors know how to sell to retailers for a slightly higher price and keep the difference as profit. This is why you’ll find wholesale distributors in furniture, electronics, office equipment, clothing and groceries.

Who Would Use Wholesale Distributors?

In most cases, wholesale distributors are used almost exclusively by retailers who need to purchase products in bulk to fill the shelves of their stores. Retailers seek out wholesale distributors all the time to provide them with bulk quantities of what they need, and have their orders shipped to them to keep in stock, whether it’s for a brick and mortar shop or a distribution warehouse for an online store. This business model is still going strong today, but a wholesale distributor’s role has expanded, especially in the digital age.

Some wholesalers have jumped at the opportunity to sell directly to customers themselves. After all, that’s a powerful position to be in when you can sell your products at wholesale and still make profit. The customers get to enjoy the additional savings  purchasing directly from the wholesaler and distributors in turn are able to raise prices slightly higher to maintain a profit.

Dropshipping has become very popular over the years, it’s a great way to utilize the low prices that are offered by wholesalers. Dropshippers usually operate online and like retailers, they will partner with wholesalers as this gives them access to great bulk deals on products.

While retailers have to purchase their products, dropshippers do not, they don’t keep any inventory on hand that they sell. When a customer places an order, the dropshipper will send the order to the wholesale distributor. The distributor then processes the order and is responsible for shipping it out to the customer.

For those that are interested in selling online, you’ll need to locate a wholesale distributor to provide you with the products you want to sell. The first step to making money online is to find the right distributor for your business. Fortunately, it’s quite easy as there’s a number of wholesale distributors online today.


*Accelerated Analytics publishes resources like this to provide insights to different analytical metrics, data points and formulas. POS Analytics. Please be aware, this doesn’t mean that our product will this metric, data point or formula. To learn exactly what our reporting covers, please feel free to schedule a demo or give us a call. Thanks for understanding.


What Is A SKU In Retail?

SKU - Stock Keeping Unit

If you can’t track it, you can’t measure it. For retailers, tracking inventory, sales and key retail KPIs are invaluable for success. Speaking of inventory, how do retailers keep track of all their products? Well, they use coding systems to keep track of their inventory and to measure sales. These codes are extremely important and can make the difference when stores need to know when reorder points should take place. They can help inform you when you need to add safety stock. They also allow retailers the opportunity to gauge which products are moving off the shelves.

By definition, a (SKU) or stock keeping unit is a specific number assigned to a product by the retail store to identify the price, product options and the manufacturer of the merchandise. SKUs are used to track inventory in your retail store. They are very valuable in helping you maintain a profitable retail business.

When accessed in your point of sale (POS) or accounting system, a SKU is a series of numbers that tracks unique insights related to that product. If you use a POS, you likely already know how important your POS data is.

SKUs are not universal, not like universal product codes (UPCs),  which means that each retailer will use their own SKUs for merchandise.

While there’s a number of different combinations SKUs can use, most of them are broken down into 2 groups;

  • Categories
  • Classifications

Many retailers will use series of numbers in their SKU to group products together for analysis. Due to this, we want to give you a few examples. We’ll go DIY on this one. For example, 35-10xxxx could be for a tool box and 35-20xxxx could be for a tool box with tools. The next number could be the identifier of the color. So, 35-10001x could be for a blue tool box and 35-10002x could be for the red tool box.

How Are SKUs Used?

When you break down companies that use SKUs like a Champ, Amazon reigns supreme.

For example, when customers begin shopping using a SKU, Amazon will auto populate related products based on your selections. Since the SKU has traits for each product, they know which products to display when you’re searching. Now, Amazon also has cookies that are much more intelligent versus that of the SKU, but stock keeping units are still useful.

Most POS systems will allow you to create your SKU hierarchy or architecture. Before you create an elaborate system for your inventory, consider what you will truly track.

For independent retailers, you’re likely not going to track beyond classification. For example, a watch store might classify watches based on customer type (men, women, children), style, color, and material.

Larger watch stores may use categories to break down the classifications more, such as Rolex types or trends. With an item’s SKU, a retailer is able to track its inventory and sales through detailed analytical reporting, such as POS analytics.

Have you ever been in a retail store and seen the associate scan the SKU or UPC label to see if there were any more in the stockroom? Inventory management is the core function of an SKU, but it can also improve the shopping experience of your customers. Being able to immediately identify your stock levels helps you take care of the customer faster.

While a lot of people don’t recognize it, another great benefit of a SKU is in advertising.

With such a large competitive landscape in retail today and many retailers matching prices, having unique SKUs can be the difference in higher profit margins.

*Accelerated Analytics publishes resources like this to provide insights to different analytical metrics, data points and formulas. Please be aware, we’re not claiming that our POS reporting services will offer this example or any other metric, data point or formula. To learn exactly what our reporting covers, please feel free to schedule a demo or give us a call. Thanks for understanding.

Calculating Your Breakeven Point

Breakeven Point Calculation

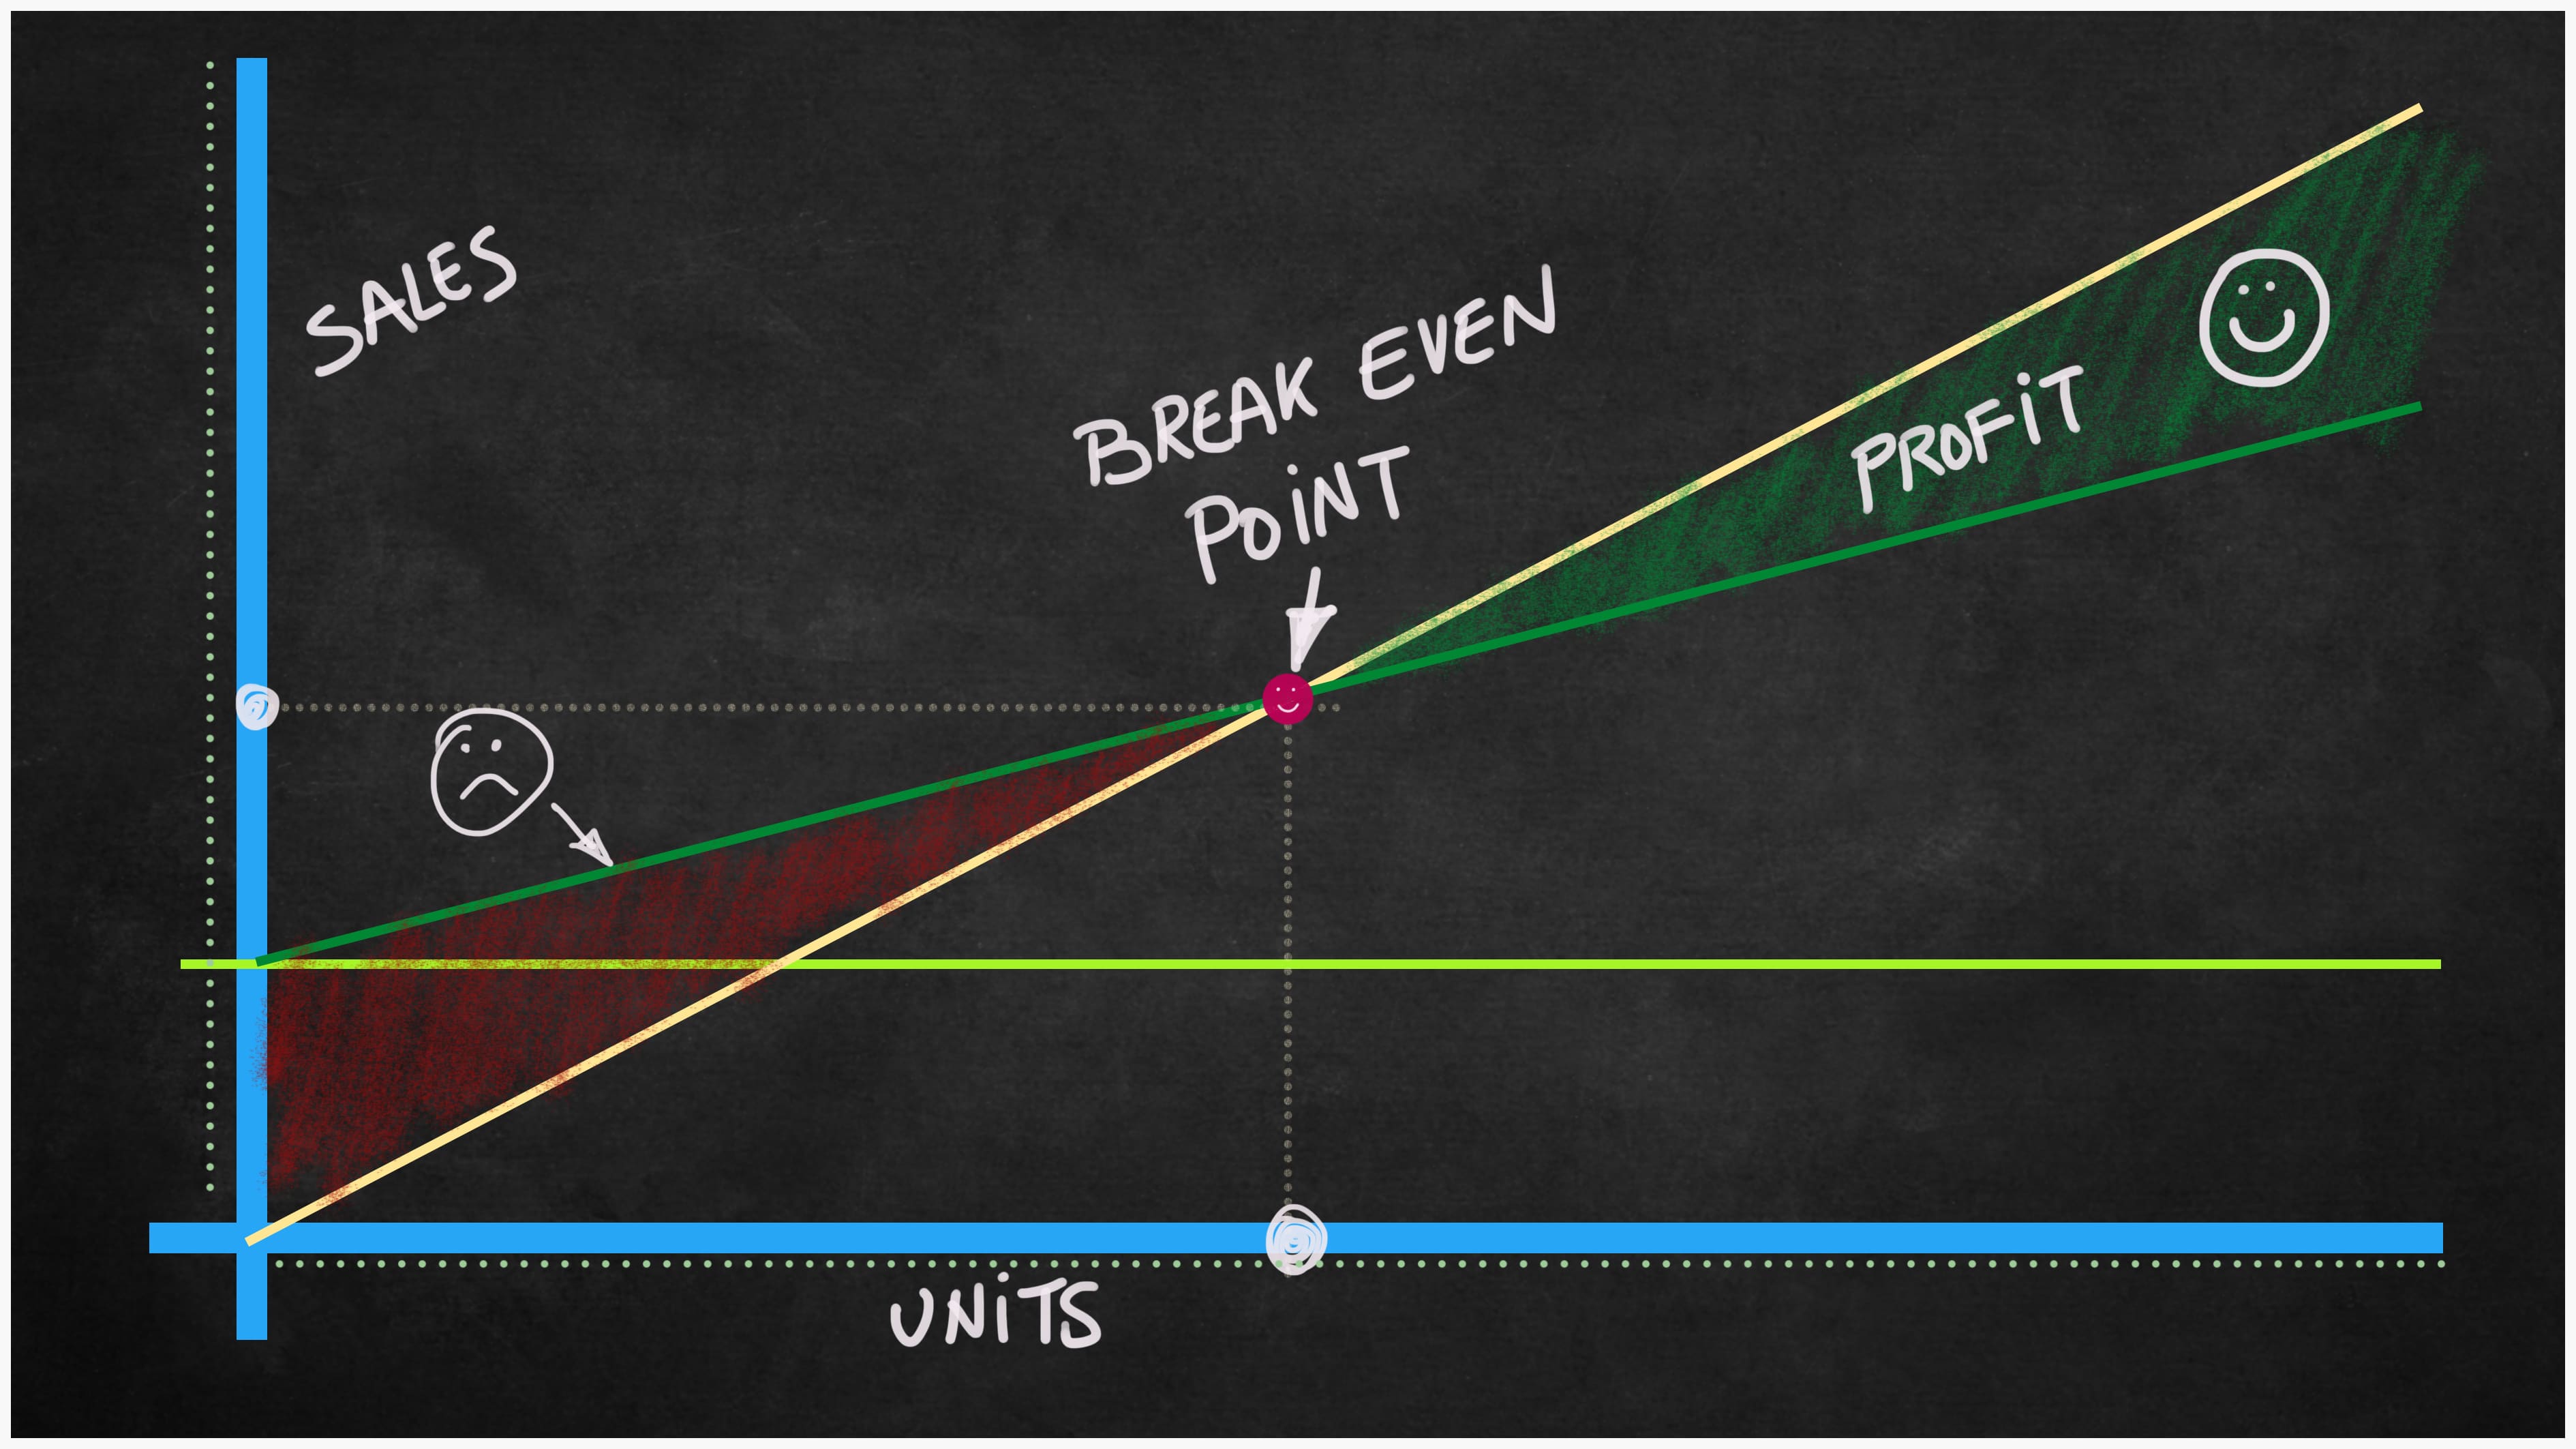
Having the ability to calculate your breakeven point is very important. After all, every unit sold afterward is profit, it’s a very important business metric. Once you know the fixed and variable costs for the product your company produces, you can then use that information to calculate your breakeven point for that specific product or service.

Small business owners can use the breakeven calculation to determine how many product units they need to sell at a specific price point to break even.

The Breakeven Point

A company’s breakeven point is the point at which it will cover all expenses related to that product by selling a unit at a specific price point. To analyze a company’s break even point in sales volume, there’s going to be 3 variables you need to know:

  • Fixed Costs: Costs that are independent of sales volume, such as rent
  • Variable Costs: Costs that are dependent on sales volume, such as the cost of manufacturing the product
  • Selling Price: The selling price needed to break even

How to Calculate Breakeven Point

In order to calculate your company’s breakeven point, you’ll need to use the following formula:

Fixed Costs ÷ (Price – Variable Costs) = Breakeven Point in Units

Now, the breakeven point is equal to the total fixed costs divided by the difference between the unit price and variable costs. With this formula, fixed costs are stated as the total of all overhead for the company, whereas Price and Variable Costs are stated as per unit costs, which would be ​​the price for each product unit sold.

The denominator of this equation, price minus variable costs, would be referred to as the contribution margin. After unit variable costs are subtracted from the price, the amount left (contribution margin) ​is available to pay the fixed costs for that business.

An Example of Finding the Breakeven Point

ABCD Company has calculated that it has fixed costs that consist of its rent, depreciation of assets and executive salaries. Those fixed costs add up to a total of $60,000. Their product is an ecommerce plugin. Their variable costs associated with producing the plugin includes raw material, labor and sales commissions. Variable costs have been calculated to be $0.80 per unit. The plugin is priced at $2.00 each.

With this information, we can calculate the breakeven point for ABCD Company’s product by using our formula above:

$60,000 ÷ ($2.00 – $0.80) = 50,000 units

What this answer means is that ABCD Company has to produce and sell 50,000 plugins in order to cover all of their expenses, fixed and variable. At this stage of sales, they would make no profit but will break even.

What Happens to the Breakeven Point If Sales Change

That’s a great question. What happens if your sales do change? For example, if the economy slows down, your sales might decline. If sales are down, you risk not selling enough to hit your breakeven point. In the example of ABCD Company, you might not sell the 50,000 units needed to break even.

In that case, you wouldn’t be able to pay all your expenses. This is a bad scenario to be in, what can you do? If you look at the breakeven formula, you can see that there’s 2 possible solutions to this problem:

  • You raise your prices
  • You cut fixed and variable cost

How Cutting Costs Affects the Breakeven Point

Let’s say you find a way to cut the cost of your overhead or fixed costs by negotiating a deal to cut your insurance by $10,000. In this case, your fixed costs drop from $60,000 to $50,000. Using the same formula and holding all other variables exactly as before, the breakeven point would then be:

$50,000 ÷ ($2.00-$0.80) = 41,666 units

In that case, cutting fixed costs allows you to drop our breakeven point.

If you reduce your variable costs by cutting your costs of goods sold to $0.60 per unit, holding everything else the same, you can see our breakeven point becomes:

$60,000 ÷ ($2.00-$0.60) = 42,857 units

From this analysis, you can see that if you can reduce the cost variables, you can also lower your breakeven point. In this example, we did it without raising the price.

How Fixed Costs, Variable Costs, Price, and Volume Relate

As the owner of a small business, you can see that any decision you make about pricing your product, the costs you incur in your business, and sales volume are interrelated. Calculating the breakeven point is just one component of cost-volume-profit analysis, but it’s often an essential first step in establishing a sales price-point that ensures a profit.

*Accelerated Analytics publishes resources like this to provide insights to different analytical metrics, data points and formulas. Please be aware, we’re not claiming that our POS reporting services will offer this example or any other metric, data point or formula. To learn exactly what our reporting covers, please feel free to schedule a demo or give us a call. Thanks for understanding.