What is EDI 852? EDI 852 is a standard data format used to transmit product activity data. Files are typically sent daily or weekly and will include sales activity by product, and for some retailers, inventory on-hand. Activity is typically summarized at a distribution center level, unless store level data is deliberately selected. Some EDI 852 forms will also include pricing information, inventory on-hand but unavailable for sale, order point, order quantity, and order status. EDI 852 is provided as a text data file using special character sets to describe the coded data to the decoding software.
My organization is a manufacturer and our retail customers are offering to send us point of sale data. Can we use Accelerated Analytics® to analyze POS data?
Absolutely! Accelerated Analytics® was designed to provide business users with a simple and effective means to analyze POS data from both a buyer and manufacturer/supplier perspective. Our engineers can work with your team as well as the retailer to load the data into Accelerated Analytics® and format your custom reports.
Can we use Accelerated Analytics® to analyze EDI 852 data?
Yes. As a part of our service we accept EDI 852 data and provide the translation into a useable format for reporting and analysis.
What’s the difference between point of sale data and EDI 852?
First, the format of the data is very different. EDI 852 is provided as a text data file using special character sets to describe the coded data to the decoding software. If you open an un-translated EDI 852 file, you will have a very hard time understanding what you are looking at. POS data, on the other hand, is typically provided in a text file with descriptive column headers, which can be easily opened and used in Excel. Second, EDI 852 contains a basic set of product activity data, while a POS file is usually much more rich. POS often will include cost and price information, and more detail inventory.
What retailers are you working with today?
A list of our currently covered retailers can be found
here.
What industries do your vendor customers work in?
Our customers include apparel, footwear, consumer products, specialty hardlines, health and beauty, pharmaceuticals, and grocery.
Do we have to setup our own reports?
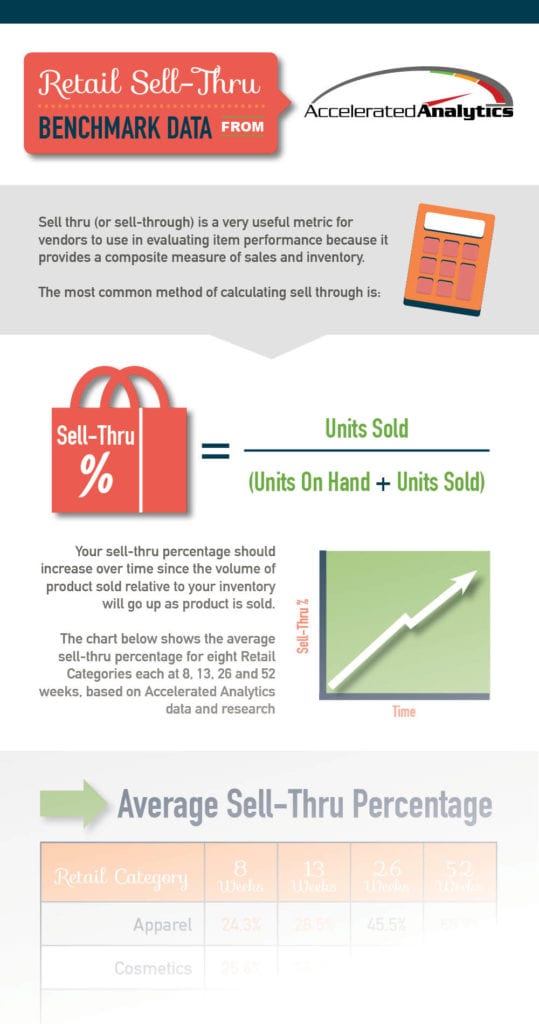
Not unless you want to. Our service includes many pre-configure template reports that we customize during the on-boarding process to meet our customers precise needs. Templates are included for sell-thru, stock-out exposure, inventory on-hand, period over period sale and inventory comparisons, top selling items, and much more. All reports can be viewed by product, product category, store, geography, time, etc. The reports are saved and available to end users with one click of the mouse.
What is collaborative forecasting, planning and replenishment (CPFR)?
(CPFR) Collaborative Planning, Forecasting, and Replenishment is a business practices that combines the intelligence of multiple trading partners in the demand planning and fulfillment of customer demand. CPFR was pioneered by Wal-Mart as a next step to efficient consumer response (ECR) and vendor managed inventory (VMI) and is now promoted by the Voluntary Interindustry Commerce Standards Association (VICS). CPR is a proven retail supply chain improvement process.
What is the bullwhip effect and why is it important?
The bullwhip effect among supply chain partners is a situation in which the supplier has a clearer view of demand than the retailer, but a less accurate forecast. Traditional supply chains are extremely prone to this bullwhip effect; typical order fluctuations of +/-5% on the customer end can easily balloon to +/-40% on the manufacturer end, thus showing an increasing demand variation of 2:1 at each level of the supply chain. Accurate forecasting can help to eliminate the bullwhip effect and increase overall profitability by 5%. The most effective way of smoothing out bullwhip effect oscillations is for suppliers to understand what drives demand and supply patterns. Understanding demand and supply patterns is best accomplished through a detailed look at POS data.
What makes Accelerated Analytics® unique?
Accelerated Analytics® connects buyers and suppliers in a collaborative environment, where point-of-sale data is used to improve forecast accuracy, demand planning, and decrease stock-outs. The Accelerated Analytics® environment is a hosted service including pre-configured reports, world-class analysis tools, and color coded exception dashboards. These tools quickly turn data into actionable information and promote data based decision making. With Accelerated Analytics®, there is no software to buy or install and Rainmaker Group does all the data processing.
Who are some companies that have implemented collaborative planning forecasting and replenishment (CPFR)?
Over 150 companies have implemented collaborative planning forecasting and replenishment (CPFR) including: Sara Lee, Wal-Mart, Schering-Plough, Walgreens, Kmart, Target, Eckerd, Safeway, Ace Hardware, Manco, Canadian Tire, Johnson & Johnson, Carrefour, Henkel, Kimberly-Clark, Marks & Spencer, Metro, Proctor & Gamble, Sainsbury’s, Nestle, Best Buy, Scan Disk, and Federated. In all likelihood, there are many more unpublished implementations as well.
How is my retail supply chain improved by demand planning using EDI, DDSN, or CPFR?
Studies of retailers by Harvard Business, Grocery Manufacturers Association, National Retail Federation, and AMR Research show results of 15% less inventory, 17% better perfect order performance, and 35% shorter cash-to-cash cycles. The close collaboration between buyers and suppliers makes these improvements possible. Accelerated Analytics® provides the technology in a hosted service so there is no hardware or software to purchase.
If our suppliers are not asking for POS data, why should I consider Accelerated Analytics®?
It’s not a surprise your suppliers are not asking for data. Most suppliers are intimidated by the prospect of asking for POS data and they do not have the tools to manage and analyze that volume of data. Successful business transformation does not begin as a reaction, but rather because business leaders have the vision to proactively invest in tools which drive their business forward faster than their competition. Research shows that when retailers proactively engage suppliers to collaborate on demand forecasting, 57% report improved relationships. Demand planning in the retail supply chain and collaboration between buyers and sellers, leads to more accurate forecasts and higher sales.
Why can’t we just use our electronic data interchange (EDI) system to send suppliers demand planning data?
Many retailers have tried using EDI 852 to take advantage of collaboration and demand planning opportunities with suppliers. This is a natural first step; the infrastructure for EDI 852 is already in place, serving as the communication medium between retailers and suppliers. But most retailers are finding that sending out an EDI 852 document with summarized POS and inventory replenishment does not provide much benefit. Why? EDI does not add any new information; EDI is summarized at such a high level, it provides about the same detail as the purchase orders already in the system. The best a supplier can do with EDI 852 is load it into excel, because they do not have an analysis tool. In addition, parsing out a separate EDI 852 file every week for each supplier is time intensive. Most importantly, the supplier rarely has the tools necessary to accept the data and conduct effective analysis.

