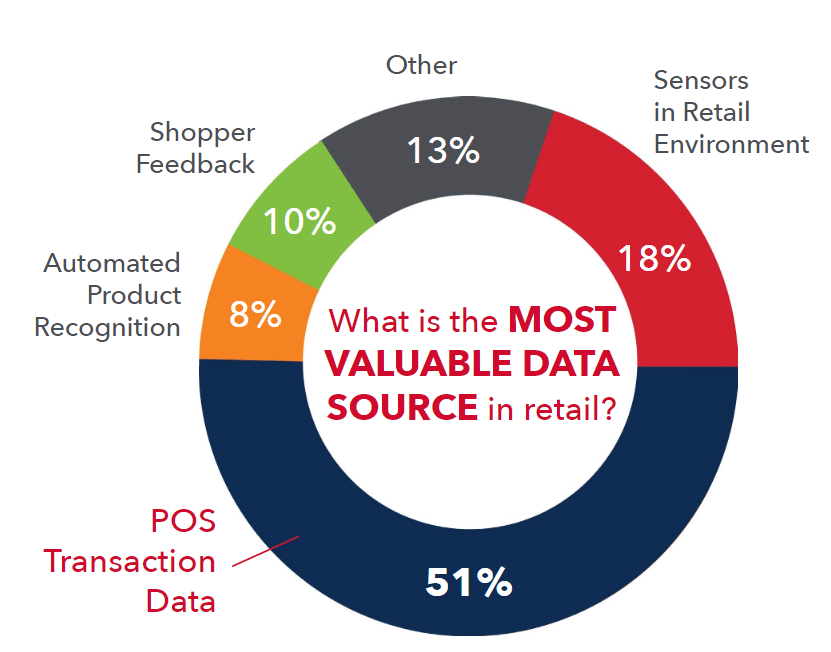
 Think that your Point-of-Sale (POS) System is ‘just a cash register’ that doesn’t contribute to driving innovation in your business?
That is a HUGE myth. But you’re not alone. Perhaps you’ve yet to discover all the ways to leverage your POS data; if that’s the case, your business has been missing out in so many ways.
The data that your POS system collects during every transaction is a gold mine in terms of being incredibly useful in improving your business. This data is, like gold, a valuable set of tools for merchants wishing to optimize their business; however, many business owners don’t know where to begin when it comes to how to analyze the copious amounts of information they’re faced with.
Keep reading for your crash course on POS data and what wonderful, advantageous things you can do with it.
What is POS Data?
Your Point of Sale system, as mentioned above, is a wealth of information that tracks your inventory levels, units sold, and dollars earned – but that’s just the beginning. Nearly all retailers use POS, both brick and mortar, as well as online stores.
The information within your POS system includes business insight data – such as Inventory Status and Business Management, and customer insight data – such as who is buying, why they are buying, what they prefer to buy, when they buy, where they buy (online, offline or in which stores) and a lot more useful data relating to customers.
POS systems can hold a lot of data. Now, POS can be used digitally or through traditional means. For example, you could use a source such as POS Paper, which has a wide range thermal paper rolls you can use for your POS systems. There’s a number of different POS rolls to choose from. Every POS system is different and has varying features, benefits, and needs.
Let’s get back to the data though. Here’s what you should be asking: How much farther can this data take my business?
Why analyze POS Data?
Every day, POS terminals collect vast quantities of data; however, this data is raw, a form in which it’s minimally useful to you. All of this gathered data needs to be funneled into one place, where it can be validated and organized so that you may pull up specific insightful reports using said data. The goal is maximum utility of your data. In its final form, POS data can help you track and forecast your stock counts, optimize your marketing campaigns, give you a better understanding of your customers’ needs and much more.
Basic POS Data Analysis
 Inventory Reporting and Analysis
Imagine this scenario: You’re selling a lot of product but not seeing profit. Why?
Well, there’s a good chance that your inventory data isn’t serving you as well as it could. However, you could easily track the inventory status with a single click.
One of our most-used reports is the Product-to-Date Report, which shows sales-to-stock ratios and weeks-of-supply with on-hand and on-order inventory levels. In-stock percentages, turns and average units and dollars are also displayed.
To avoid the mistake in ordering out-of-stock products, the POS system will automatically update stocks in real time and hide unavailable items for online customers. The system also instantly notifies your sales staff if the number of items added to cart is higher than the available quantity in the selected warehouse.
Unsurprisingly, one of retail’s largest concerns for 2019 is improving the customer experience. Knowing exactly what you have on hand, in transit, on order and on the shelf is key to achieving the satisfying customer experience.
Multi-retailer data analysis
With our Geographic Store Across Retailers Report, you can look at product-level performance across geography and across retailers. Try answering these questions without access to this report:
What and where is your customer buying?
What sells better at each retailer? How did recent product launches or promotions go? What is your product inventory spread across retailers?
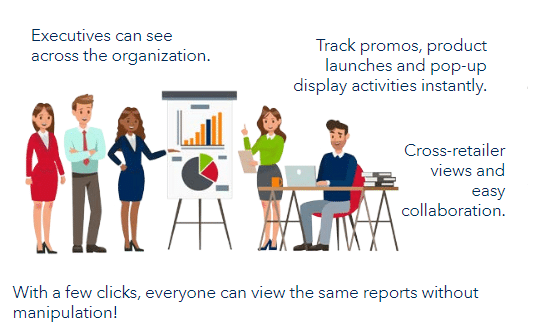
These questions are laborious and time-consuming to answer manually, but this point of sale report provides all your retail analytics and is specially built to gain a better internal analysis of your business in real time.
 Sales Trends and KPIs
In addition to specific sales and inventory levels at each store, the Store Sales Data Report shows the number of active stores, weeks selling in stores, sell-through, sales-to-stock ratios, weeks of supply and turn. With flexible date ranges, this data report is a great snapshot of store (and online) performance with year-over-year comparisons. The report helps identify top- and bottom-performing stores and their contribution to total sales within a retailer. Cross-retailer views also allow for competitive analysis for stores that are in the same geographical area.
Additionally, the KPI Report provides a quick snapshot of your key performance indicators on one report. You can easily see if each KPI is up, down, or flat. This report is easily viewed, exported and shared, even on mobile; what’s more, we can add your sales plan in order to convey performance vs. plan.
Returns, Exchanges and Refunds
Merchandise returns resulted in $351 billion in lost sales in the U.S. in 2017, according to a report from Appriss Retail. For context, the US national debt was around $400 billion during that time.
While product returns are probably one of the most undesirable facets of business, they’re pretty much unavoidable. But even these can contribute valuable data to help you gain significant insights into your customers’ wants and needs.
Regularly monitoring these activities can reveal a variety of trends. Pay attention to any specific trends involving returned products. Dig deeper. Are the products defective? Does the item simply not meet customers’ expectations?
What type of refund do customers typically prefer? Most POS systems allow merchants to refund past orders to the original payment method or make exchanges for store credit. Whether customers take the store credit option or simply want their money back can affect your bottom line.
This kind of POS data analysis can help you make small changes, like eliminating certain products from your shelves, that could make a big impact on your revenues, but this gets more complicated when it comes to transforming to an omnichannel model. Businesses utilizing POS data analysis tools to help track and manage inventory levels in stores and fulfillment centers can work with their retailer buyers to optimize their working capital investments in inventory and partner with them to create a better customer experience and reduce their lost sales opportunities. Read more about omnichannel here.
 ROI
ROI
As you can see, the amount of data gathered by your point of sale system is staggering. Typically, the manual process of gathering this data, sorting it out and putting it into comprehensive reports is exhaustively long. Not only are you paying more for people to gather the POS data and create the reports, by the time you get them in-hand they’re yesterday’s news! We automate all of these steps so that all your POS reports can be retrieved with a single click, saving time, money and energy and ultimately boosting your bottom line.


