Tag: POS Reporting

Calculating Sell-Through

What is sell-through?

Sell-through is a metric for vendors to use in evaluating item performance which provides a composite measure of sales and inventory. Sell-through rates are typically evaluated daily for fast-moving products or weekly for slower-moving or replenishment-based products.  A higher value is better, indicating your sales velocity is good and your inventory is appropriately forecasted. If sell-through is low, this indicates either poor sales or too much inventory.

How do I calculate sell-through?

The most common calculation is:

SELL-THROUGH % = UNITS SOLD / (UNITS ON HAND + UNITS SOLD)

In most cases, sell-through for an item is compared in recent periods (such as current week and last week), as well as in aggregate across several months to a year.

When evaluating sell-through, it can be useful to group together products which have been selling for a similar period of time and/or which are sold into the similar store types. For example, comparing sell-through for a product with 5 weeks of selling activity against a product with 20 weeks of selling activity most likely will not produce a useful comparison. In the same way, comparing sell-through for a product in a group of stores in a highly affluent area is not likely to compare favorably to a group of stores with a low-income level.

What is sell-through data used for?

Sell Through Report

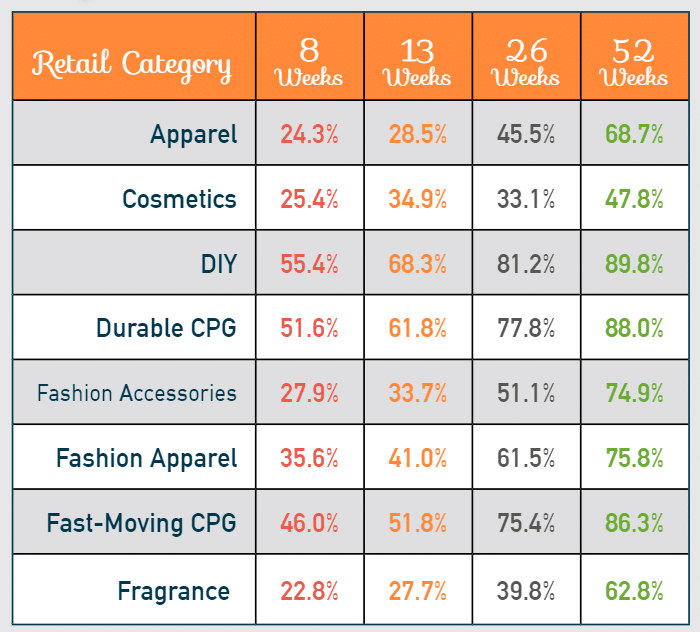
Based on Accelerated Analytics data

Most retail buyers have a set sell-through percentage they use to evaluate vendors based on product category or department.  It is important for vendors to discuss the sell-through expectations with the buyer in order to align with those objectives.

For reference, we’ve compiled sell-through percentage data
that you can use as a benchmark. The infographic includes
the sell-through percentage for eight retail categories
each at 8, 13, 26 and 52 weeks.
Sell-Through Data Tracking


GET STARTED Identify trends, optimize assortments, and track promotions with one-click access to sell-through rates for every one of your SKUs with POS reporting and analytics from Accelerated Analytics!
Find out how we can help you make faster and better-informed decisions with real-time retail data and insightful analytics.

Accelerated Analytics Sponsors HIRI Conference in Chicago

Accelerated Analytics was pleased to be a repeat-sponsor of the Home Improvement Research Institute (HIRI) event on September 18 and 19. The 2018 Insights Conference hosted many DIY, home and hardware vendors and retailers to discuss key economic indicators, trends and forecasts for this division of the retail industry. Topics included global economic impacts on the home improvement market, trends in remodeling and home building, and the evolving healthy home range of products coming to market. The conference was held at the historic McDonald’s Hamburger University in Oak Brook, IL. Accelerated Analytics was the only POS analytics reporting solution provider at the event, and welcomed many current and newly-signed DIY vendor customers. Many attended a dinner hosted by Accelerated Analytics CEO, Chad Symens, and Director of Sales and Marketing, Jennifer Freyer, at Wildfire in Oak Brooke.

POS Reporting Provider

Home Depot Crushes Q2 2018 Sales

POS Reporting Services

Home Depot Q2 2018 Sales, Accelerated Analytics’ Customers Up 8.9 Percent

The Home Depot announced its Q2 2018 sales results, and once again it was a smashing success story for the DIY retailer. Accelerated Analytics checked the results of our customers who sell in and use our reporting for managing their business with The Home Depot. For the third straight quarter, our customers outperformed Home Depot’s total sales results!

Are you a Home Depot DIY retailer? Accelerated Analytics customers reported an 8.9% increase in US store comp sales over last year. Home Depot at large reported an increase of 8.1% over 2017 for the same period. Our customers are using our reporting and analysis tools to decrease out of stocks, improve store performance and reduce lost sales opportunities. Being the third quarter in a row of this superb trend is a testament to our customers and our tools!

If you’re a DIY retailer that wants to increase sales and performance, Accelerated Analytics can help. Our POS data analysis and reporting tools will allow you to see your data as a whole so you can start making real-time decisions that will impact the performance of your business. If you’re tired of trying to make sense out of all your data and missing out on the many opportunities you have to grow your company, we can help.

You can reach us by calling 1-915-746-2073 or by using our contact form.

Accelerated Analytics Third 2018 Innovation Award Goes to Vera Bradley

POS Reporting Solution

Accelerated Analytics awarded its third and final 2018 INNOVATION AWARD to General Merchandise and Apparel category winner, Vera Bradley. Accelerated Analytics CEO, Chad Symens, and Director of Sales and Marketing, Jen Freyer, presented the award to Shequeita Orr, Vera Bradley’s Director of Sales and Business Planning, in their NYC showroom. The Vera Bradley team uses their Accelerated Analytics POS Apparel and Fashion reporting solution for their key department store and military store channels. Their ability to use the reports to strategize and effectively market their assortments earned them this year’s award. Congratulations to the Vera Bradley team!


The Top 5 Retail POS Reports in 2017

Whether they sell lighting fixtures or lip gloss, our customers understand the power of leveraging retail POS data to gain valuable insights into their business. And while the go-to reports for a planning executive for a cosmetics company might be different from the reports that a hardware store field rep relies on each day, there are five Accelerated Analytics reports that emerged as customer favorites across all brand categories in 2017:

Print & Go Door Level Report

Most often used by Beauty vendors, Print & Go Door Level Reports reveal a brand’s most important store level activity and sales results. Each page of the report is designed to reflect activity for a particular door and the report is designed so the user can quickly see results from a product category perspective. At a glance, the user can see last week’s sales, comp to last year, % to plan, and balance to get to plan. In addition to the prior week, the report shows month, season, and year to date results, as well as full prior year and current contribution to their total chain. The report displays such that each page reflects one door. This report is ideal to distribute to store managers and beauty consultants on the selling floor so they can direct sales and inventory to meet and exceed plan goals.

Store Sales Data Report

In addition to specific sales and inventory levels at each store, the Store Sales Data Report shows the number of active stores, weeks selling in stores, sell through, sales-to-stock ratios, weeks-of-supply and turn. With flexible date ranges, this report is a great snapshot of store performance with this year/last year comps. Online sales are also represented as a “store” in the report. The report helps identify top and bottom performing stores and their contribution to total sales within a retailer. Cross-retailer views also allow for competitive analysis for stores that are in the same geographical area.

Geographic Store Across Retailers Report

Because your data is multi-retailer, you can look at product level performance across geography and across retailers. Where is your customer buying? What is your customer buying? What sells better at each retailer? How did your product launch or promotion go? What is your product inventory spread across retailers? This report is critical to gain a better internal analysis of your business.

Dashboard/Scorecard Report

Dashboards and scorecard reports quickly identify units and dollars sales metrics, as well as top and bottom performing products and stores. The report can be run from a total corporate, retailer-specific and store-specific view, as well as blend cross-retailer information to identify performance across your key accounts.

Product-to-Date Report

In addition to the basics, the Product-to-Date Report shows sales-to-stock ratios and weeks-of-supply with on-hand and on-order inventory levels. In-stock percentages, turns and average units and dollars are also displayed.

Infographic: Top 5 Reports of 2017

Request and download our infographic detailing the benefits of each of our top 5 reports:

POS Reporting Tools Being Used by Luxury Brands

POS Reporting Tools

Luxury brands are constantly struggling with department stores’ need to markdown their merchandise, which hurts the prestige and high value of their brand. Over this Christmas season, brands such as Ralph Lauren, Michael Kors and Kate Spade are watching sales and inventory levels very closely each week. When possible, retailers are even monitoring daily, looking at sell-through percentages to determine if they need to mark products down to keep sales-to-stock ratios balanced. Customer buying trends of ordering online and returning the item to a brick and mortar store exacerbates the problem. Brands needs to be on top of the data to try to make recommendations that don’t result in retailers marking their merchandise down. The trick at the end of the holiday season is not to sell the most, but to end up with the least amount of unsold merchandise going into January. Using POS data and staying informed about where their merchandise is at all times helps brands alleviate the need to buy more than they need, “just in case”.

Source: businessoffashion.com

Walmart Announces Huge Wins in Q3

Walmart E-Commerce ReportWalmart announced its third quarter results, which exceeded economic estimates. They reported online sales growth of 50%, and total revenue rising 4.2% to $123.2 billion, versus estimates of $121 billion. Walmart US rose to $77.7 billion, and same store growth over last year increased 2.7%, which was Walmart’s 13th consecutive quarterly increase. Based on Q3’s success, the retailer increased its annual earnings expectations. Walmart continues to unveil strategies to compete against Amazon. Last week it announced that it was partnering with Lord & Taylor to bring an online fashion store to Walmart.com. They are also building strong relationships with brands such as KitchenAid and Bose. As they head into holiday selling, they are focused on their automation of inventory checking and offering same and next-day delivery.

Sources: Chain Store Age, Business Insider

Accelerated Analytics Sponsored the 2017 HIRI Insights Conference in Chicago

HIRI Sponsored by Accelerated Analytics

Accelerated Analytics’ CEO, Chad Symens, and Director of Sales and Marketing, Jen Freyer, attended and sponsored the Home Improvement Research Institute event in Chicago this week. HIRI saw a record turnout of attendees at this 2-day event. Home and hardware vendors and retailers joined industry leaders to share insights into the current and future market of retail and the economy in this sector. The speakers brought many common themes to their topics. Home improvement projects are on the rise as millennials start to purchase their first homes and are buying older homes that need renovations. Generation X and Baby Boomers are staying in their current homes longer, adding projects from basement restorations to bath and kitchen remodels. The experts agreed that repair and remodeling spending will continue to go up in the next year. The biggest areas of home improvement projects also include adding technology to make homes “smart”, energy efficiencies, exterior landscaping and outdoor living, and retrofitting older homes. Estimates are that there will be a 57% increase in DIY spending, as many homeowners are trending towards doing multiple and bigger projects all at once. Consumers are indicating they want to invest in their homes and their family circle. Consumer confidence is high and unemployment is low, both great indicators of continuing the upward trend. The Home Depot and Lowe’s both produced very high same-sales in Q2 of this year. Accelerated Analytics’ vendor customers saw even higher gains than that, by tracking stock levels and making informed choices with regard to their product mix in those stores.

Why All the Doom and Gloom? Retail is Up!

Forrester announced retail sales results just as the first half of an NRF/4-5-4/4-4-5 2017 season has come to a close. For most retailers, this week marks the first for the fall season/second half of the 2017 retail year. The news seems abundant about retail stores closings, missed sales targets and retail executives not getting bonuses, but retail is actually doing well! The US retail market has grown 3.8% so far this year, already surpassing 2016’s 2.4% growth. Sales are expected to hit $3.56 trillion this year.Retail Sales are Up

Online sales are expected to rise 14% this year to $459 billion, making 12.9% or total retail sales. Apparel, consumer electronics and computers still dominate as top producing products sold online. The news is also full of doom and gloom about Amazon hurting other retailers, but Forrester announced that while Amazon is growing at 19% over 2016 and last year 83% of adult Americans purchased at least once from Amazon, 55% also admitted using Amazon online as a resource to research products before physically purchasing elsewhere.

Are online sales hurting brick and mortar stores as much as we hear? Ecommerce sales do cause damage to retailers’ margins as they shift to a variable-cost model from a fixed-cost store model. Stores have been closing: 2000 in 2016 and a combined total of 10,000 over the past 3 years, but those stores actually are only 0.7% of the 1.44 million retail establishments in the US. Retail square footage per person in the US is averaging 24 square feet versus 16 square feet for Canadians and 4.6 square feet for every Briton. In May, 2,861 store openings were announced, proving retailers are strategically closing in weak malls.

Forrester stated in its report that the main thing holding retailers back right now is “unresolved pain points, undifferentiated (customer) experiences, decisions based on opinion rather than data”.

Sources: Retaildive.com, Marketwatch

Luxury Retailers Suffer Amid the Transparency of Online Competition

Luxury retailers have historically been considered immune to the challenges of mass-market chains, like declining foot traffic and endless price wars, but that no longer appears to be true. High-end retailers are learning that even wealthy customers are hunting for better deals and selection empowered by the pricing and supply transparency of an omni-channel marketplace.

“In the past, women had loyalty to a particular department store, and they would come in with a page torn from the retailer’s catalog and say, ‘I want that look,” said Robert Burke, the former fashion director of Bergdorf Goodman who now runs his own consulting firm.

According to global management consulting firm Bain & Co., sales of personal luxury goods such as apparel and handbags fell 1% last year, the first decline since 2009.

Few are feeling the heat like luxury retailer Neiman Marcus, which holds nearly $5 billion in debt. When Neiman Marcus opened its first store in Dallas in 1907, they built their brand catering to the wealthy.

“Our mantra had always been, ‘There is nothing too expensive for our customer,” one former executive said.

Neiman Marcus routinely increased average prices by 7% – 9% annually until 2015. But the model of lifting profits by simply raising prices has fallen out of fashion. The same strategy has been common among many luxury retailers giving consumers little choice because distribution of high-end goods was tightly controlled by the brands. And until recently, few luxury goods were sold online giving brands tighter control of pricing.

“One of the tricks to luxury is price discipline,” said Aaron Cheris, the head of Bain’s retail practice for the Americas. Shoppers pay full price, he said, when they can’t “get stuff for less.”

But competition from online and discount retailers, where prices change rapidly to remain competitive, is forcing discounts and forcing change to remain competitive.

In today’s WSJ Logistics Report, author Paul Page wrote that luxury retailers need to “look for ways to lower production and distribution costs, use data in a more sophisticated way and follow their customers in displaying a new kind of discipline in pricing.”

Accelerated Analytics provides POS reporting and analysis for several luxury brands like Bvlgari, Chanel, Oscar de la Renta and more, who sell through luxury retailers like Neiman Marcus & Bergdorf Goodman. You can learn more about our expert data and analysis solutions for fashion and beauty vendors on the solutions pages of our website.

Sources: wsj.com, WSJ Logistics Report

To subscribe to our weekly news updates and have our content delivered directly to your inbox each week, enter your e-mail address at the bottom of our Home page.