Tag: sell-through

Client Spotlight: Vera Bradley

Vera Bradley Capitalizes on Opportunities by Leveraging POS DataVera Bradley POS Data Reports

In 2013, when the business leaders at Vera Bradley were bringing on Dillard’s, their first big department store, they knew it would be critically important to be able to see their sell-through. When they asked the team at Dillard’s for sell-through data, Dillard’s quickly introduced Vera Bradley to Accelerated Analytics and a strong and valuable relationship began. As Vera Bradley expanded into additional department stores, Accelerated Analytics was with them every step of the way.

Challenges

As Vera Bradley expanded into new retailers, they knew that one of the keys to their successful growth would be the ability to compare sales across retailers. Relying solely on each individual retailer for sales data would mean looking at multiple reports with inconsistent formats and verbiage. Deriving the comparisons and analysis that would be essential to the success of their growth strategy would be time consuming and challenging. Accelerated Analytics provided a solution that allowed Vera Bradley to see all of their sales data across retailers, in a consistent format.

“We can react quickly because we have visibility; patterns are emotional and numbers don’t lie.”
– Heidi McClain, Business Planner, Vera Bradley

Vera Bradley Utilizes POS ReportingData Visibility Empowers Vera Bradley to Make Timely, Informed Decisions

From the business planners to the account managers and sales team, multiple departments use our POS reports and analysis provided to Vera Bradley by Accelerated Analytics. Business Planner Heidi McClain values the ability to see the “store and SKU attributes how we want to see them as opposed to how the retailer provides them.” She explains that the SKU-level sales versus top-level sales “speak volumes to our account managers.” McClain provides a weekly selling summary to the sales team, enabling them to compare sales across retailers, identify strengths and opportunities, and react quickly. Vera Bradley’s Director of Information Architecture says that Accelerated Analytics is “like having an extension of my team,” and points to the value of the sell-through data as one of the most valuable aspects of the Accelerated Analytics tool. Accelerated Analytics data and reports empower the Vera Bradley team with the knowledge of what’s selling and what’s not, and enables them to react quickly.

• In 2015 when Vera Bradley launched new doors with one of their existing department stores, from day one they were able to identify opportunities in current inventory and quickly partner with them to make adjustments.

• When the Vera Bradley team needs to know how an account is performing they can view its success geographically and easily see its percent to total.

• When one of their department store partners passed on a top pattern, Accelerated Analytics data helped show Vera Bradley how well the pattern was performing within other retail partners. That gave the store the confidence to add it to their assortment. Since adding it, this retailer’s sales have continued to increase and the pattern is one of their top performers to date.


About Vera Bradley Guided by their founders, Patricia R. Miller and Barbara Bradley Baekgaard, Vera Bradley has earned a reputation as a leader in the gift industry. Creating stylish quilted cotton luggage, handbags and accessories, the company combines smart product designs with distinctive and colorful fabrics and trims.

Calculating Sell-Through

What is sell-through?

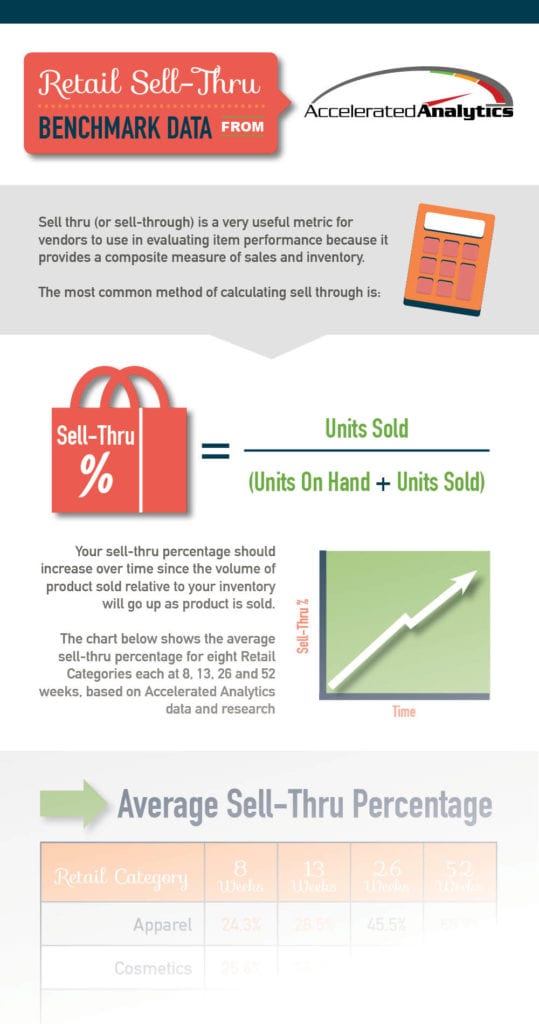
Sell-through is a metric for vendors to use in evaluating item performance which provides a composite measure of sales and inventory. Sell-through rates are typically evaluated daily for fast-moving products or weekly for slower-moving or replenishment-based products.  A higher value is better, indicating your sales velocity is good and your inventory is appropriately forecasted. If sell-through is low, this indicates either poor sales or too much inventory.

How do I calculate sell-through?

The most common calculation is:

SELL-THROUGH % = UNITS SOLD / (UNITS ON HAND + UNITS SOLD)

In most cases, sell-through for an item is compared in recent periods (such as current week and last week), as well as in aggregate across several months to a year.

When evaluating sell-through, it can be useful to group together products which have been selling for a similar period of time and/or which are sold into the similar store types. For example, comparing sell-through for a product with 5 weeks of selling activity against a product with 20 weeks of selling activity most likely will not produce a useful comparison. In the same way, comparing sell-through for a product in a group of stores in a highly affluent area is not likely to compare favorably to a group of stores with a low-income level.

What is sell-through data used for?

Sell Through Report

Based on Accelerated Analytics data

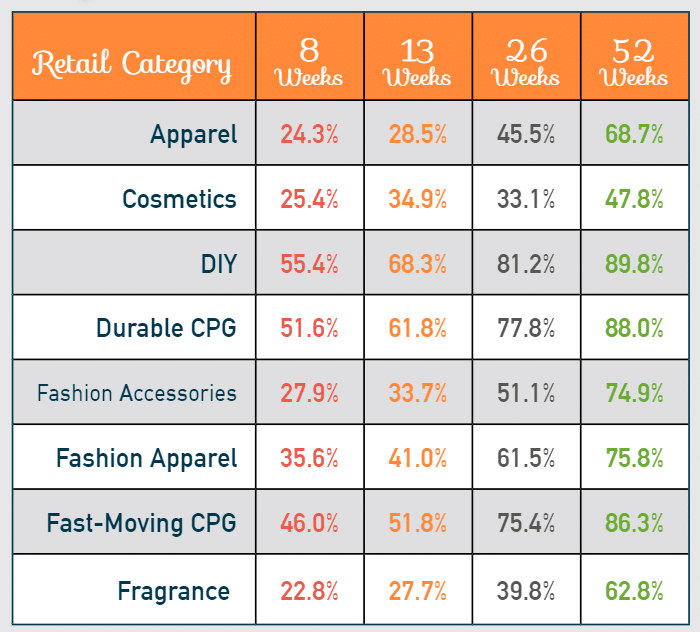
Most retail buyers have a set sell-through percentage they use to evaluate vendors based on product category or department.  It is important for vendors to discuss the sell-through expectations with the buyer in order to align with those objectives.

For reference, we’ve compiled sell-through percentage data
that you can use as a benchmark. The infographic includes
the sell-through percentage for eight retail categories
each at 8, 13, 26 and 52 weeks.
Sell-Through Data Tracking


GET STARTED Identify trends, optimize assortments, and track promotions with one-click access to sell-through rates for every one of your SKUs with POS reporting and analytics from Accelerated Analytics!
Find out how we can help you make faster and better-informed decisions with real-time retail data and insightful analytics.

Calculating Sell-Thru

Retail Sell-Thru

Sell through (or sell-thru) is a very useful metric for vendors to use in evaluating item performance, because it provides a composite measure of sales and inventory. But like many business measures, there is more than one method of calculating sell through.

The most common calculation is: Sell Thru % = Units Sold / (Units On-Hand + Units Sold). Sell thru is typically evaluated on a daily basis for fast moving products or weekly for slower moving or replenishment based products.  A higher value is better, indicating your sales velocity is good and your inventory is appropriately forecasted. If sell thru is low, this indicates either poor sales or too much inventory. In most cases, sell-thru for an item is compared in recent periods like current week and last week, as well as in aggregate across several months or even a year.

When evaluating sell-thru, it is also useful to group together products which have been selling for a similar period of time and/or which are sold into the similar store types. For example, comparing sell-thru for a product with 5 weeks of selling activity against a product with 20 weeks of selling activity most likely will not produce a useful comparison. In the same way, comparing sell-thru for a product in a group of stores in a highly affluent area is not likely to compare favorably to a group of stores with a low income level.

Most retail buyers have a set sell-thru percentage they use to judge vendors based on product category or department.  It is important for vendors to discuss the sell-thru expectations with the buyer in order to align with those objectives.

For reference, we’ve compiled sell-thru percentage data that you can use as a benchmark.